



The structural integrity of windscreen bonding is critical for vehicle safety, passenger comfort and long-term durability. The adhesive interface between the glass and the vehicle frame must meet strict mechanical requirements to ensure crash performance and environmental sealing. Failures in bonding can lead to detachment, leakage, excessive noise, and regulatory noncompliance.
Recent recalls illustrate the magnitude of this issue. Over the past several years, multiple manufacturers have recalled vehicles due to inadequate windscreen or glazing adhesion, including cases affecting hundreds of thousands of vehicles. These events underline the need for reliable, in-line, nondestructive inspection methods capable of verifying bonding quality before vehicles leave the assembly line.
This application note presents a proof-of-principle study demonstrating the feasibility of using vibrometry for noncontact inspection of windscreen bonding integrity.
Measurement Principle
A bonded windscreen forms a coupled mechanical system composed of the glass panel, the adhesive layer, and the vehicle body frame. When subject to acoustic or mechanical excitation, the vibration response of the system depends strongly on the quality of adhesion and boundary conditions.
If the bond is uniform and properly cured, the glass behaves as a well-coupled structural element. However, voids in the adhesive ribbon, insufficient adhesive thickness, or poor curing can lead to a poor bonding of the windshield. As a result, defective bonding areas exhibit measurable deviations in vibration behavior. This can be especially remarkable in the case of electrical vehicles, where the noise issues become more apparent since they are not masked by engine noise.
We propose that vibrometry could be used to measure out-of-plane velocity of the windscreen surface while the structure is excited. By analyzing the vibration spectrum and its spatial distribution, failure points and weak adhesion areas can be detected quantitatively. The concept supports early diagnosis through nondestructive testing and is compatible with 100 percent in-line inspection. Test times would be less than one minute.
Measurements were performed on a Tesla Model E vehicle with no known windscreen defects. Broadband excitation was generated by playing white noise through the vehicle’s stereo system at maximum volume. Photo courtesy Ommatidia Lidar
Proof-of-Principle Study
To validate the concept, measurements were performed on a Tesla Model E vehicle with no known windscreen defects. Broadband excitation was generated by playing white noise through the vehicle’s stereo system at maximum volume. This approach provided acoustic stimulation across a wide frequency range, enabling excitation of multiple structural modes.
Looking for quick answers on assembly and manufacturing topics?
Try Ask ASM, our new smart AI search tool.
Ask ASM
A sublimating spray was applied to the windscreen surface to create diffuse reflection conditions suitable for accurate optical measurement. This ensured reliable signal return from the glass surface during scanning.

The Q2 vibrometer is based on frequency modulated continuous wave lidar technology. Photo courtesy Ommatidia Lidar
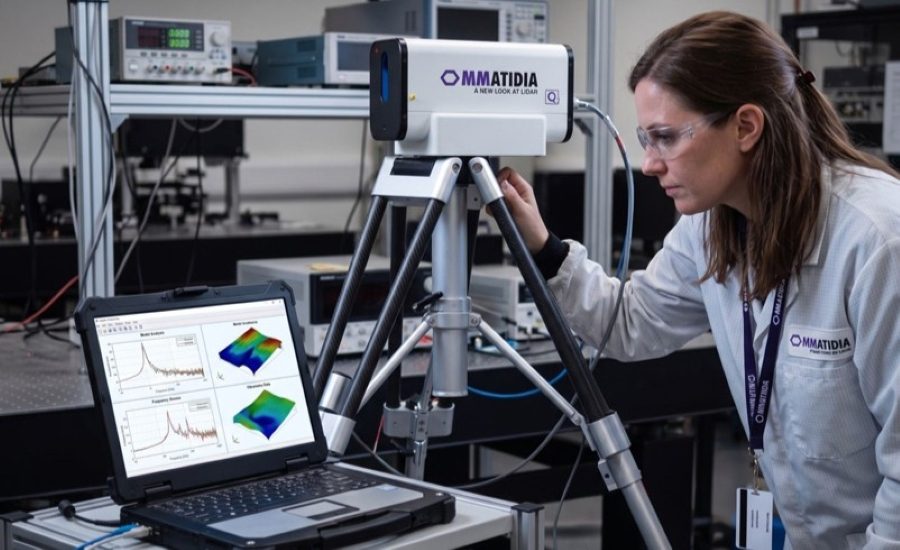
The equipment used for this test was our Q2 laser Doppler vibrometer, which is based on frequency modulated continuous wave lidar technology. The Q2 has two operating modes. Vibrometry mode measures the velocity or displacement of a surface without contact. Metrology mode measures the distance to the sensor and generates a point cloud.
This system features multichannel coherent detection, consisting of 65 simultaneous laser beams for signal acquisition. Thanks to the use of a dedicated photonic integrated circuit (PICs), the Q2 analyzes multiple optical channels in parallel, enabling the simultaneous measurement of vibrations and displacements, which is critical for transient phenomena.
The Q2’s main features include:
- Ultrafast data acquisition of between 65 and 25,600 points per second over a 360-degree sweep.
- Multipoint vibrometry sampling at 40 kilohertz across 65 simultaneous points.
- Integrated accelerometer with a bandwidth of 2,000 hertz and a sampling rate of 4,000 hertz.
- Pointing aid and autofocus with a full-HD RGB camera (1,920 by 1,080 pixels).
- IP54 protection and atmospheric compensation (pressure, temperature and humidity).
- Multiple connectivity options, including Gigabit Ethernet, GPS synchronization, analog I/O, and digital output.
- Unified software controlled via the Ommatidia Atelier platform.
- Open format data (HDF5).
The Q2 simultaneously measured 65 aligned spatial points on the windscreen surface. By scanning across the glass, a dense spatial vibration map was obtained. The measurement acquired approximately 13,000 spatial points in less than one hour, corresponding to approximately eight seconds per scan line. The frequency resolution was 0.125 hertz, with a velocity sensitivity of 0.1 micron per second. These parameters demonstrate high spectral precision and sufficient sensitivity to capture subtle vibration phenomena relevant to bonding integrity.
Of course, in the case of on-line integration, a coarser spatial resolution could be used to speed up the measurement.
Vibration Spectrum Analysis
Frequency-domain analysis of the measured signals revealed multiple resonance peaks within the low- to mid-frequency range. The fast Fourier transform (FFT) spectrum showed prominent peaks at frequencies such as 6.5, 23.5, 53.5 and 88 hertz.

This graph shows the baseline-subtracted average FFT spectrum. Photo courtesy Ommatidia Lidar
Multibeam laser vibrometry produces super-dense space resolution vibration maps at each frequency peak. These maps are shown in figure 4.
The peaks at 6.5 and 23.5 hertz are generated out of the windshield and correspond to structural vibration of the measurement setup. This can be seen in the fact that the vibration is in the wall behind the car, which was not, in fact, vibrating.
The peak at 53.5 hertz can be attributed to the vibration of the body of the car just below the windshield (figure 4, lower left graph).
At 88.5 hertz, we can see vibrations coming from the windshield. This frequency is tentatively assigned to the first bending mode of the windshield.
The measurements clearly distinguish between background vibrations and those intrinsic to the glass structure. Importantly, no abnormal increase in vibration amplitude was observed at the glass-to-frame interface in this reference vehicle. The spatial patterns were stable and consistent with a properly bonded system.

Figure 4. These images are maps of the vibrations measured on the windshield. Photo courtesy Ommatidia Lidar
Adhesion Assessment and Defect Sensitivity
From a mechanical perspective, a defective bond would be expected to alter the vibration response in several ways. Reduced local stiffness would modify resonance behavior, potentially introducing new localized modes or amplifying existing ones. Delaminated regions would behave as partially unconstrained areas, exhibiting increased vibration amplitude under acoustic or mechanical excitation. Such defects would appear in spatial FFT maps as localized regions of elevated vibration energy and altered mode shapes.
Vibrometry offers significant advantages for automotive manufacturers. The technique is entirely noncontact and nondestructive, with no risk of damaging the glass or the adhesive. The measurement process is compatible with automation and can be integrated into existing end-of-line inspection stations.
With optimized scanning strategies and parallel acquisition, sub-minute inspection times are achievable. A typical in-line implementation would involve positioning the vehicle at an inspection station, applying controlled acoustic or mechanical excitation, performing a rapid spatial scan of the windscreen, and analyzing the vibration response in real time. A pass-fail decision could then be generated automatically based on predefined acceptance criteria.
Because our method provides quantitative vibration metrics rather than subjective visual inspection, it reduces variability and enhances traceability within the assembly process.
For more information, visit
For more information on adhesive bonding and inspection, read these articles:
How to Error-Proof the Dispensing Process
Sensors Make Robots Smarter When Inserting Vehicle Windshields
New Technology Monitors Quality of Meter-Mix Process for Two-Part Adhesives
