


Bitcoin kicked off the second week of June on the back foot — and fresh multiyear lows could still lie ahead before the year ends.
- Traders expect BTC to see a short-term bounce, but most agree the true market bottom hasn’t been reached yet.
- Key US inflation data will put market confidence to the test as tensions from the US-Iran conflict continue to weigh on sentiment.
- Peace-deal pledges from US President Donald Trump have done little to calm nervous markets.
- Several on-chain indicators suggest analysts are cautiously optimistic that the worst of the sell-off may be behind us.
- Crypto sentiment has plunged to historic lows.
Bitcoin’s bear-market bottom remains months away
Bitcoin managed a modest bounce around its latest weekly close, according to TradingView data, but the absence of any significant bullish catalysts has left traders wary.
“The previous week’s candle closed with a strongly bearish tone and left a gap at $72.5K. As long as the $59.1K weekly low from last week holds, my primary long target for this week remains that $72.5K imbalance,” wrote trader Lennaert Snyder in his latest X analysis post.
BTC/USDT four-hour chart. Source: Lennaert Snyder/X
Trader Mark Cullen cautioned that even if a relief bounce materializes, the definitive bear-market low is still ahead.
“BTC has now swept the $60K level — and it happened a bit faster than I originally expected,” he shared with his X audience.
“I anticipate more sideways-to-upside movement through the rest of June. My view is that the ultimate market low won’t arrive until mid-to-late Q3.”
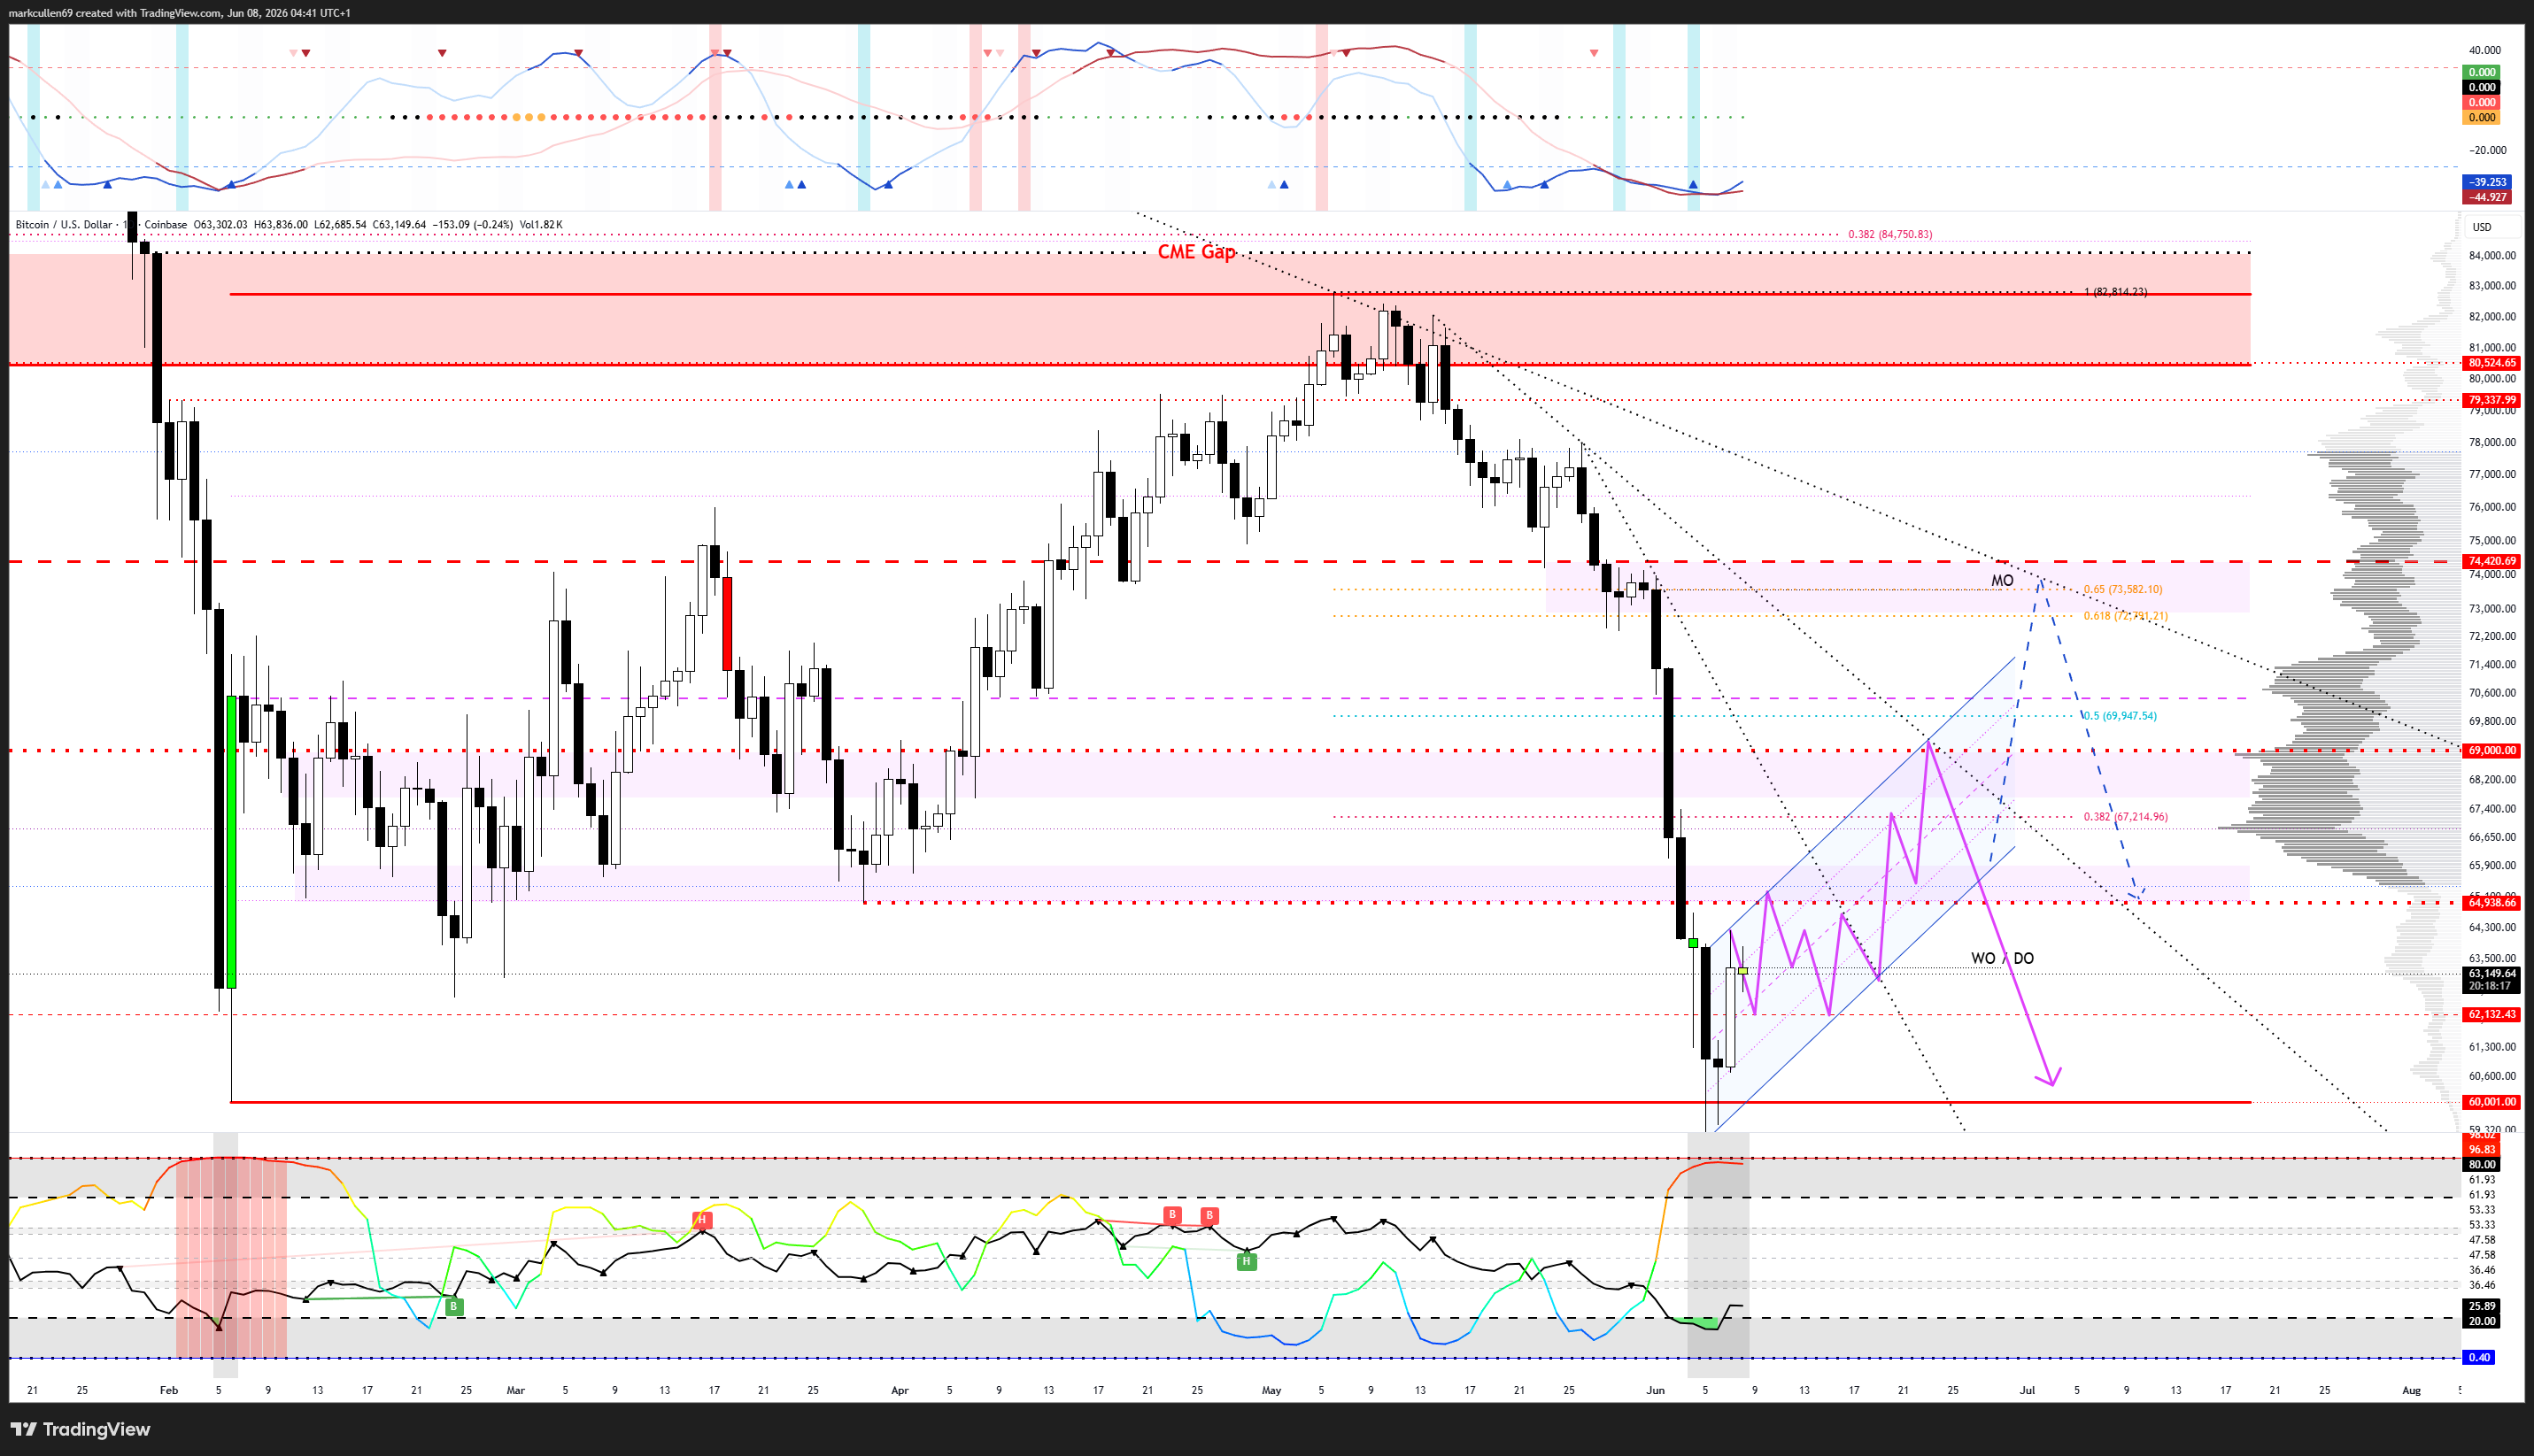
BTC/USD daily chart. Source: Mark Cullen/X
Crypto commentator ColinTalksCrypto shared a similar outlook with slightly different timing. He observed that BTC/USD had slipped below a critical long-term indicator — the 200-week simple moving average (SMA).
“This setup likely produces a rebound lasting 1–3 months, followed by a drop to a fresh low in Q4,” he explained.
ColinTalksCrypto added that Q4 “carries strong odds of marking the cycle’s ultimate bottom.”
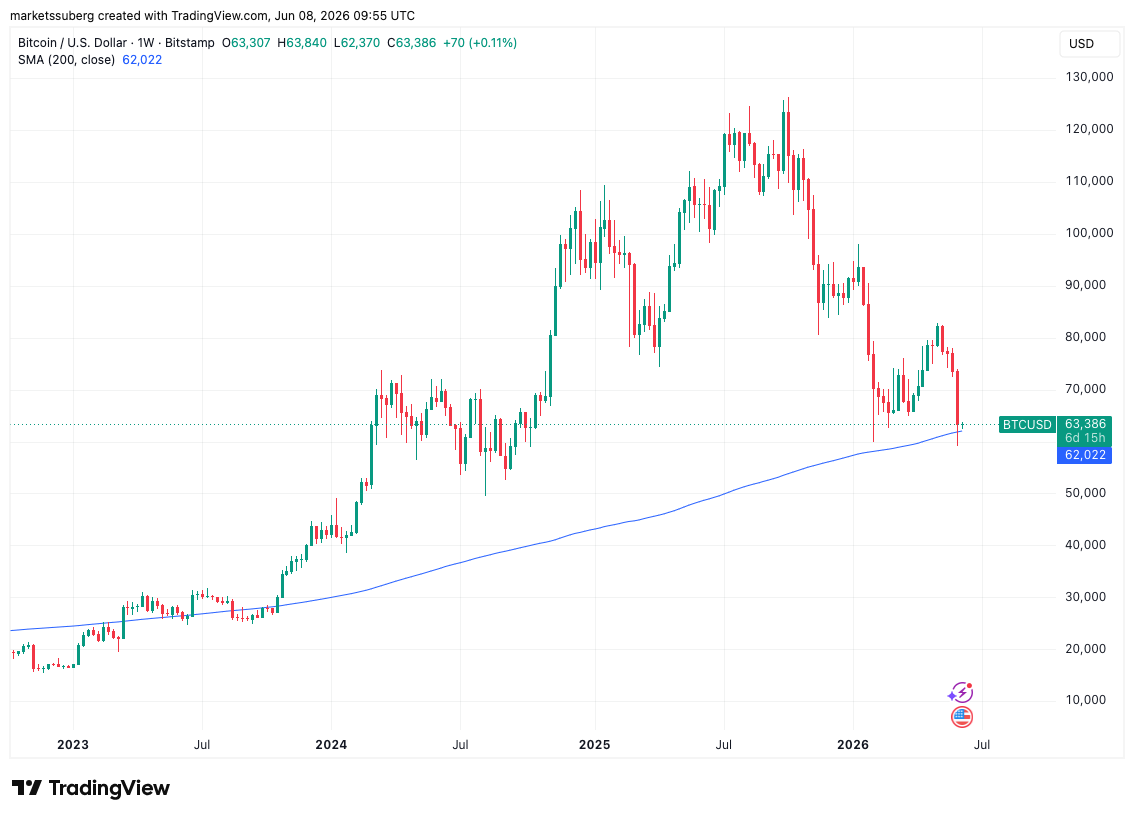
BTC/USD weekly chart with 200 SMA. Source: Cointelegraph/TradingView
CPI and PPI inflation data poised to challenge multiyear highs
US inflation data for May will add another layer of tension to markets this week, with traders already pricing in the possibility of interest-rate increases.
The May Consumer Price Index (CPI) and Producer Price Index (PPI) readings are expected to reflect the ongoing economic toll of the US-Iran conflict.
Both gauges hit multiyear highs during their last April updates, and the latest figures from CME Group’s FedWatch Tool reveal rapidly shifting expectations for Federal Reserve policy.
“The base case now points to two rate HIKES by early 2027. There’s even a growing 17% probability of three rate HIKES by April 2027,” noted market resource The Kobeissi Letter in its analysis late last week.
“Just months ago, markets were anticipating as many as four rate CUTS in 2026 alone.”
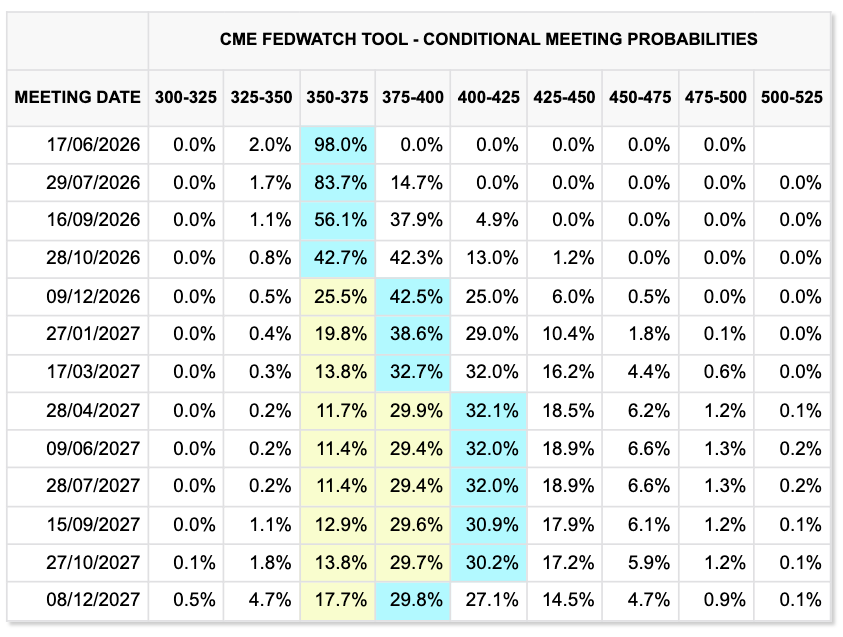
Fed target rate probabilities (screenshot). Source: CME Group
As Cointelegraph previously reported, US stock markets have largely shrugged off inflation concerns, pushing to repeated all-time highs driven by strength in tech stocks.
That picture is now looking shakier this week as fears over rate increases ripple through markets. South Korea’s stock exchange was halted for volatility on Monday following an 8% plunge at the opening bell.
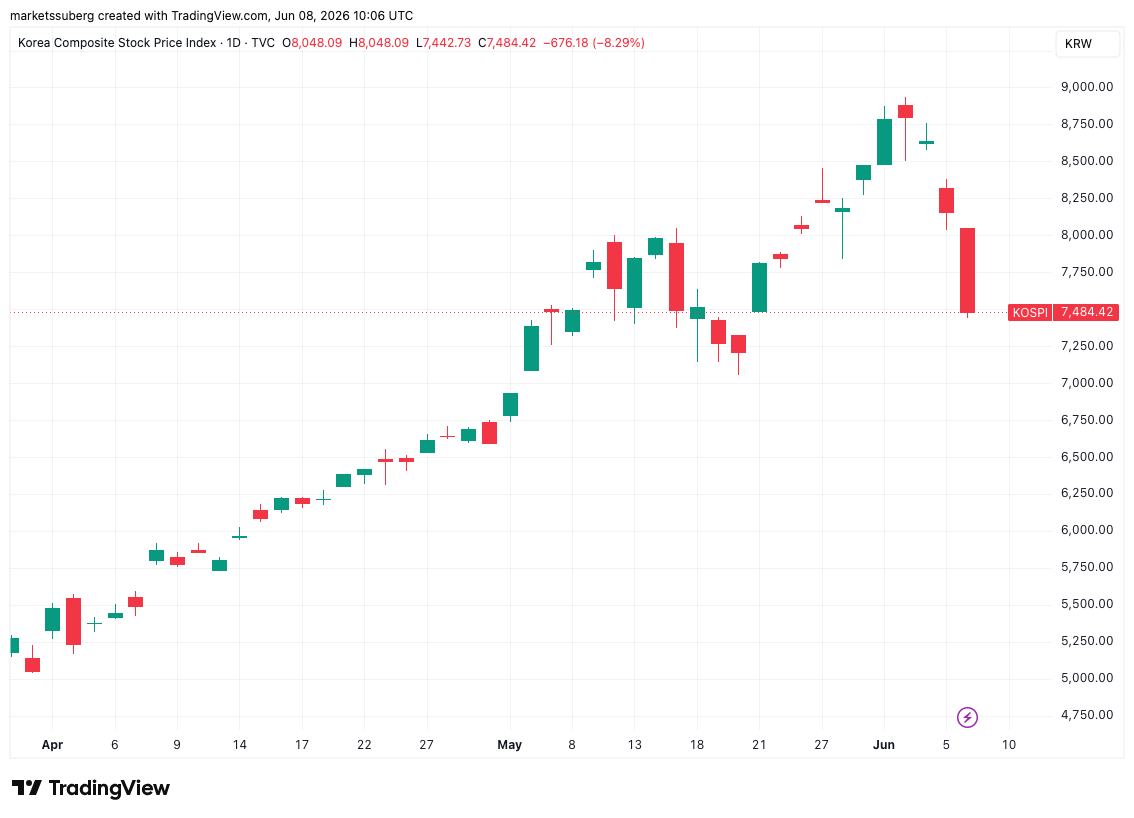
KOSPI daily chart. Source: Cointelegraph/TradingView
“Something has just shifted in the world’s hottest stock market,” remarked Nic Puckrin, founder of crypto platform Coin Bureau, on Sunday.
“Korean stocks are up 90% this year. But the options positioning on the Korea ETF has swung from bullish bets to downside hedging. That’s a clear signal that those still in the trade are losing conviction.”
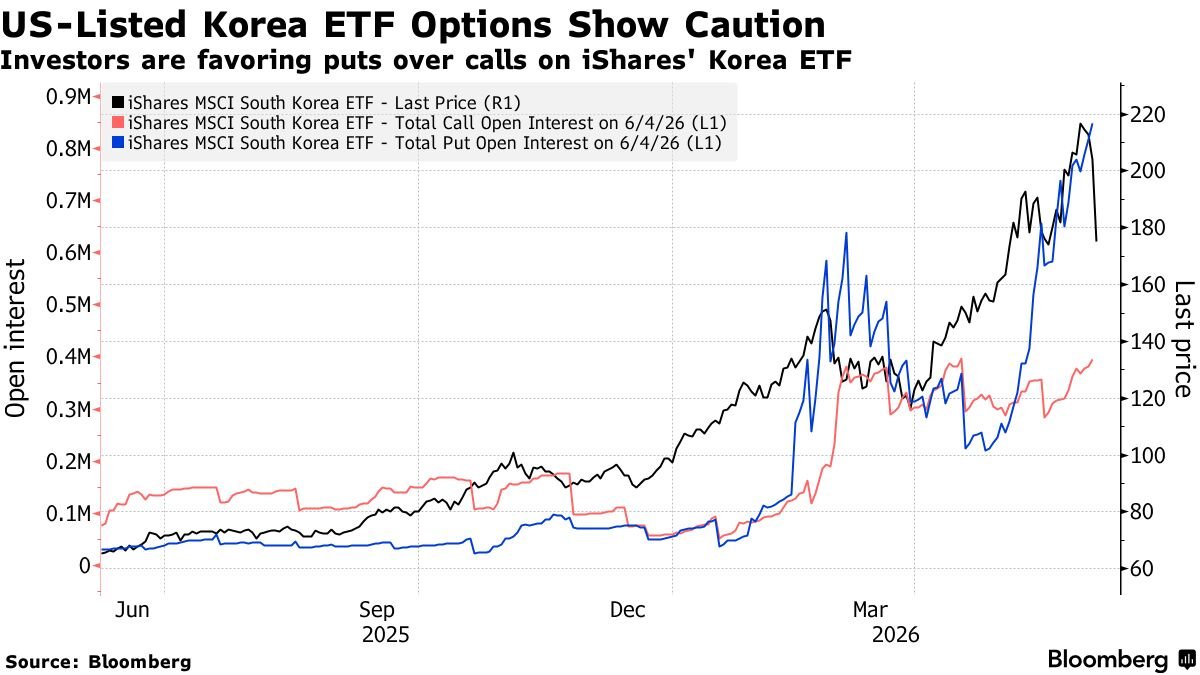
iShares South Korea ETF market data. Source: Nic Puckrin/X
Iran war peace pledges fail to soothe nervous markets
Compounding the macro uncertainty is the ongoing US-Iran conflict, which continues to act as an unpredictable trigger for market volatility.
Last week, US President Donald Trump suggested the situation would “work out well,” but those reassurances failed to prevent BTC/USD from sinking to fresh multiyear lows.
Continued exchanges of military strikes in the interim kept the atmosphere of uncertainty firmly in place.
Quoted by the Financial Times and other outlets on Sunday, Trump again tried to strike an optimistic tone, insisting that the latest attacks would not derail ongoing peace talks.
“The deal may succeed on its own merits, or it may not — but this won’t have any impact on it,” he said during a phone interview.
Bitcoin appeared to find some support in Trump’s remarks, which included his assertion that Israel would have “no choice” but to accept an agreement with Iran.
Oil prices climbed heading into the new week, with WTI crude pushing back above $95 per barrel.
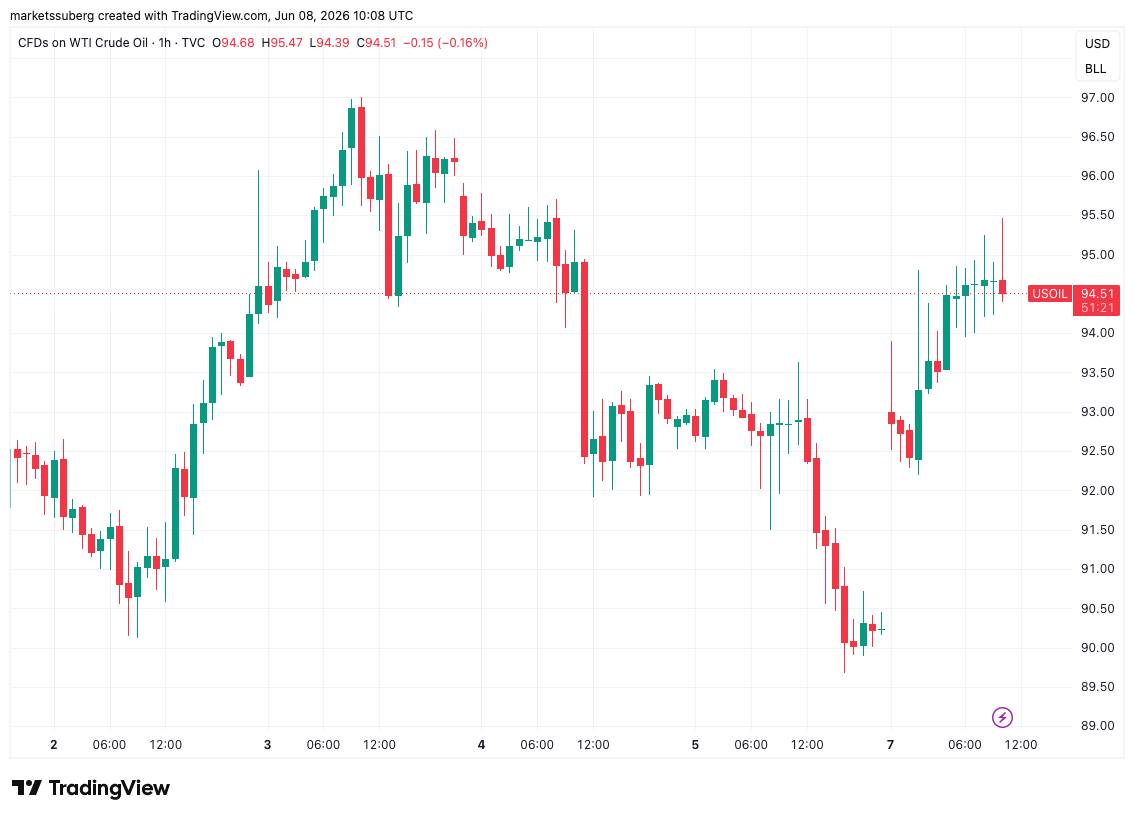
CFDs on US WTI crude oil hourly chart. Source: Cointelegraph/TradingView
Crypto trader and analyst Michaël van de Poppe weighed in, warning that the new week could get off to a rocky start.
“I’d expect prices to dip slightly at the Monday open, after equity markets tumbled sharply on Friday evening,” he told his X followers.
“Once US markets open — or possibly by Tuesday — the trend should rotate back upward, and we may start to see the first hints of positive momentum on Bitcoin.”
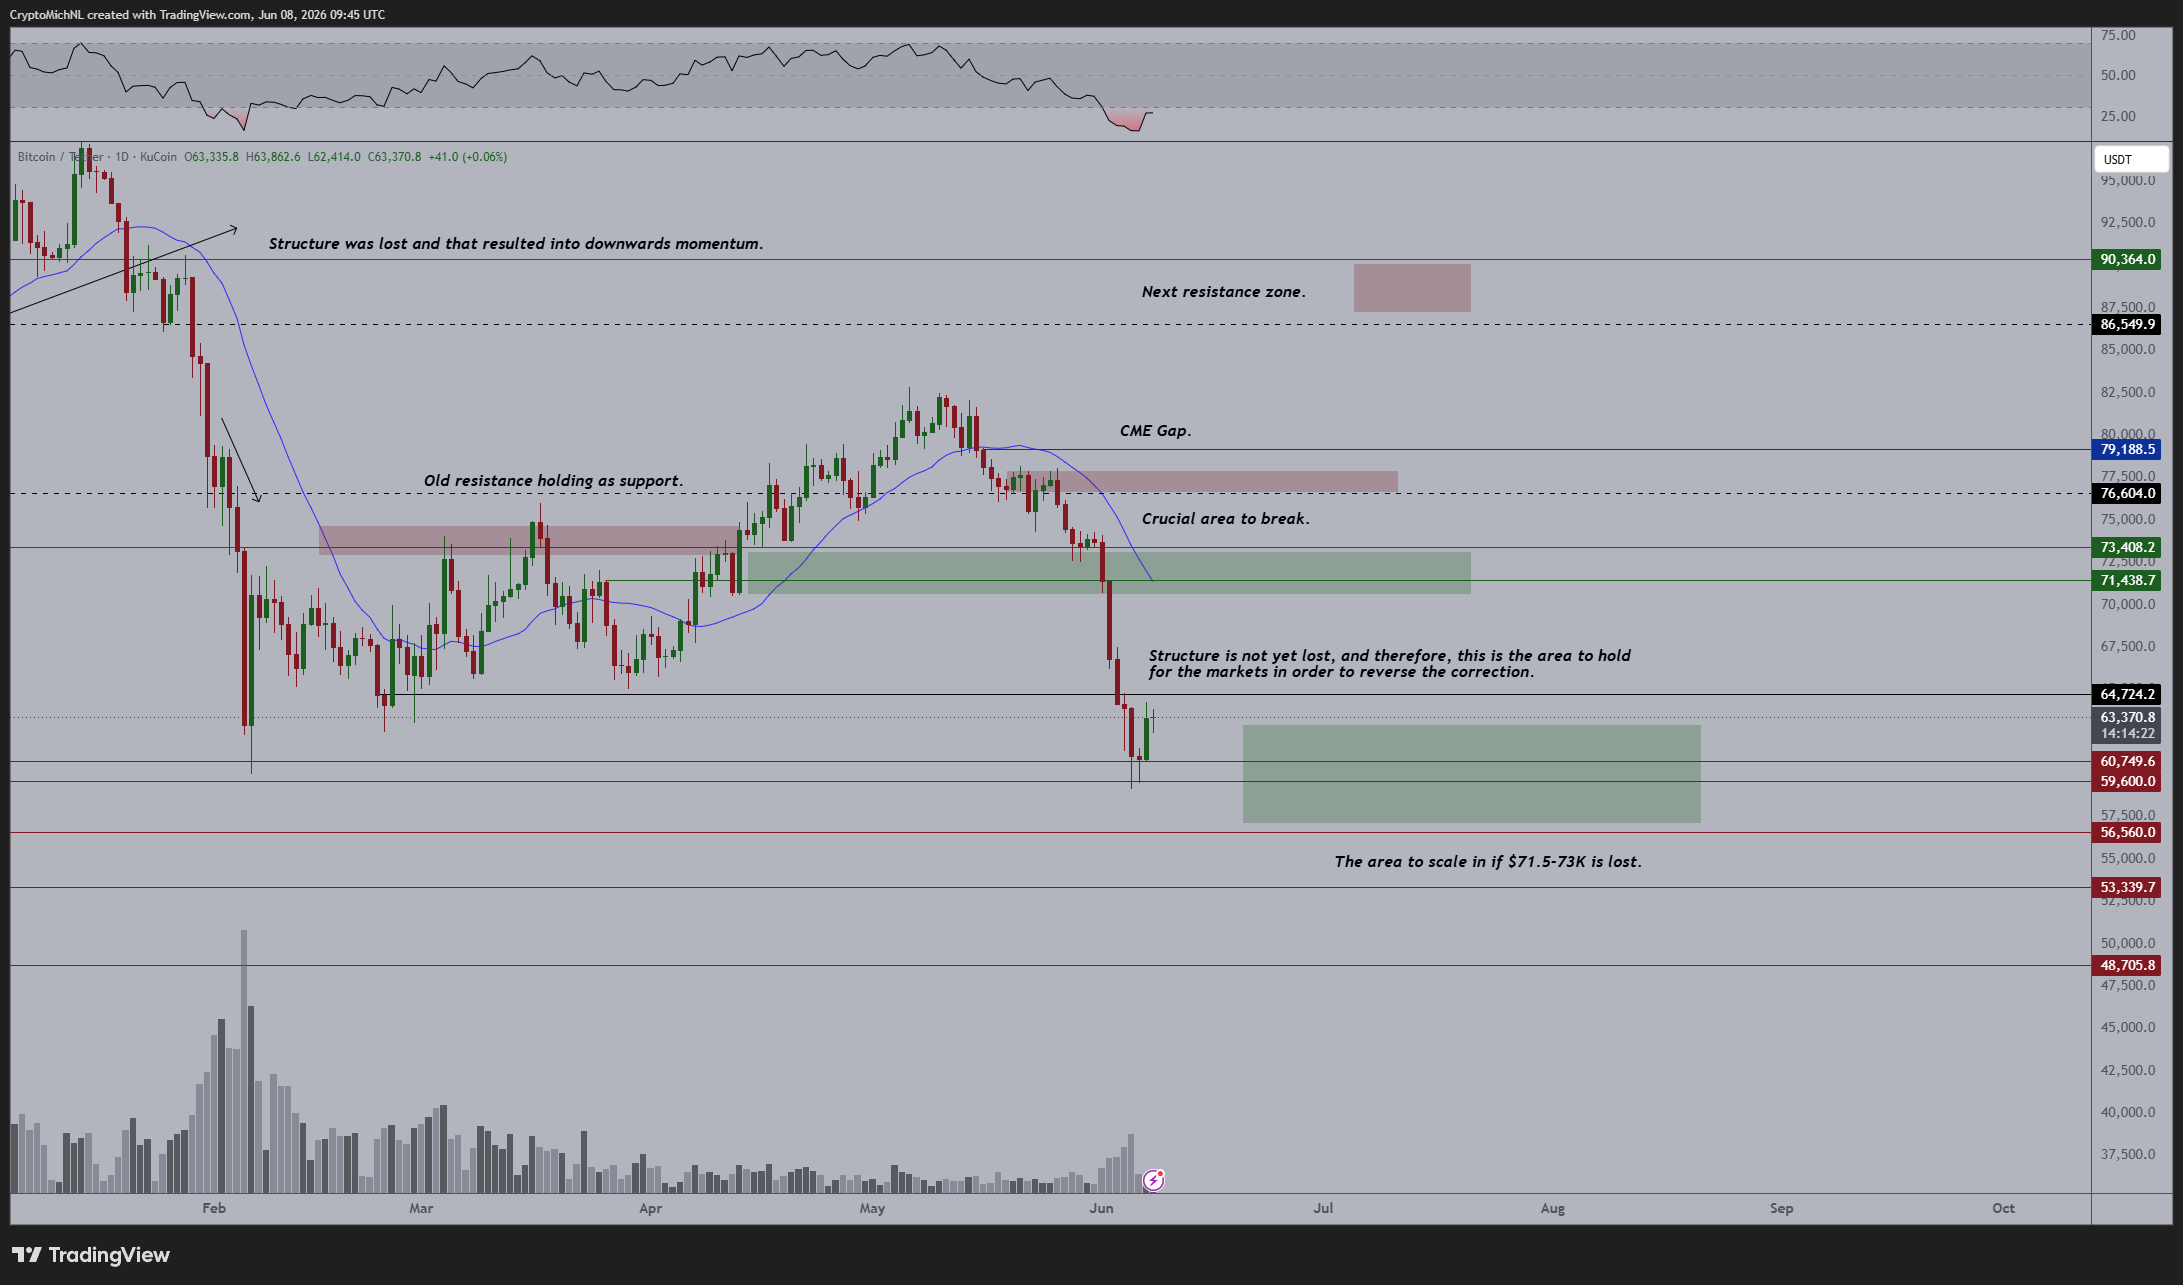
BTC/USDT daily chart. Source: Michaël van de Poppe/X
Indicators suggest sell-side pressure is cooling
Within the Bitcoin community, debate persists over whether the bottom of the bear market has already been established following BTC’s recent dip under $60,000.
Last week, Cointelegraph reported on a study that found most of the necessary conditions for a market recovery were already present.
In its latest analysis, blockchain analytics firm CryptoQuant expanded the list supporting the view that the sharpest selloff has likely passed.
“Taken together, these metrics indicate that speculative froth has largely been flushed out of the system,” analyst XWIN Japan noted in a QuickTake post.
“Market mood has shifted from irrational exuberance to wariness, and participants are entering a waiting and accumulation phase.”
The three key metrics cited are the spent output profit ratio (SOPR) for both long-term (LTH) and short-term (STH) holders, the share of Bitcoin supply sitting at a loss, and the 200-day simple moving average (SMA).
The 200-day SMA has already drawn traders’ attention after BTC/USD revisited that level for the first time since 2023 last week.
“The LTH-SOPR / STH-SOPR ratio has dropped notably, meaning long-term investors are no longer cashing in the outsized gains made during the prior rally,” XWIN explained regarding the additional metrics.
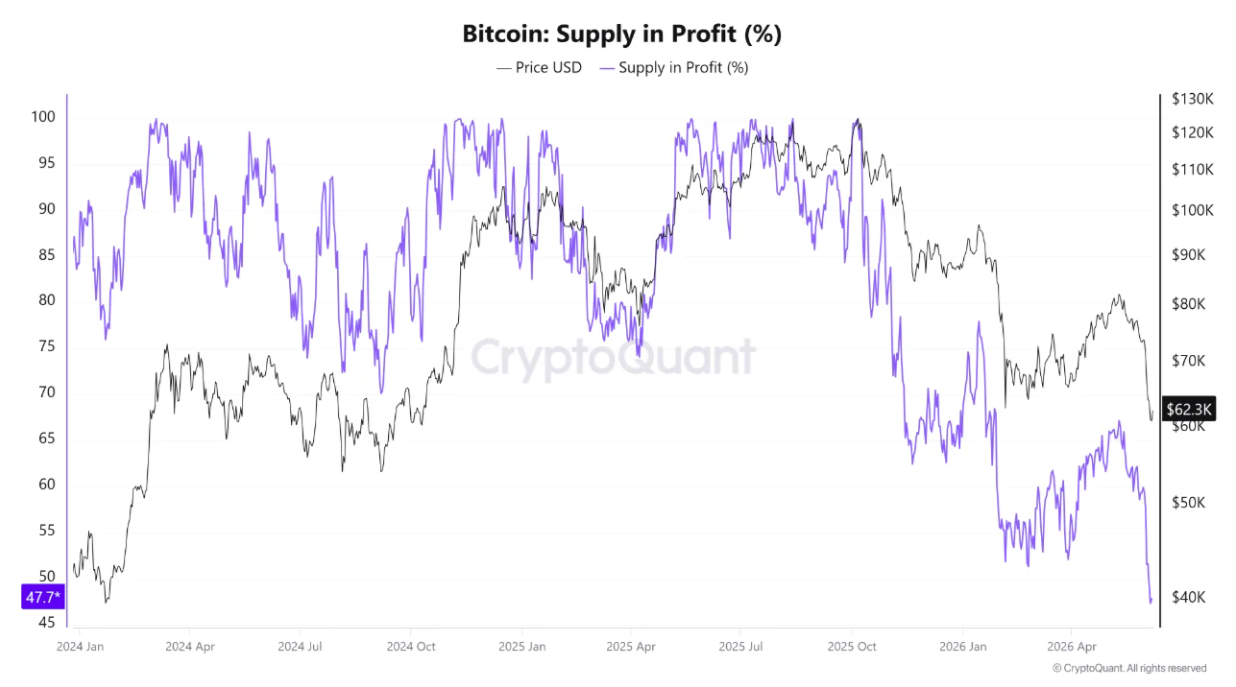
“Supply in Profit has fallen to around 47%, indicating that more than half of Bitcoin holders are now at break-even or underwater. This stands in stark contrast to bull market environments, where over 90% of supply is typically in profit.”
Bitcoin supply in profit (screenshot). Source: CryptoQuant
CryptoQuant also pointed to a “demand gap” as technology stocks have drawn attention away from digital assets more broadly.
Sentiment signals mirror those of a “broad despair” entry point
Digital asset market sentiment has plunged back into single digits, according to the Crypto Fear & Greed Index — yet a buying window may already be opening.
Related: Bitcoin faces renewed risk of a deeper selloff as unrealized bear-market losses remain $35 billion below the 2022 peak
The Index, which aggregates multiple data sources to gauge the prevailing market mood, registered just 8 out of 100 on Monday — deep in its “extreme fear” territory.
A reading this low was last seen in early April and ranks among the most pessimistic values ever on record.
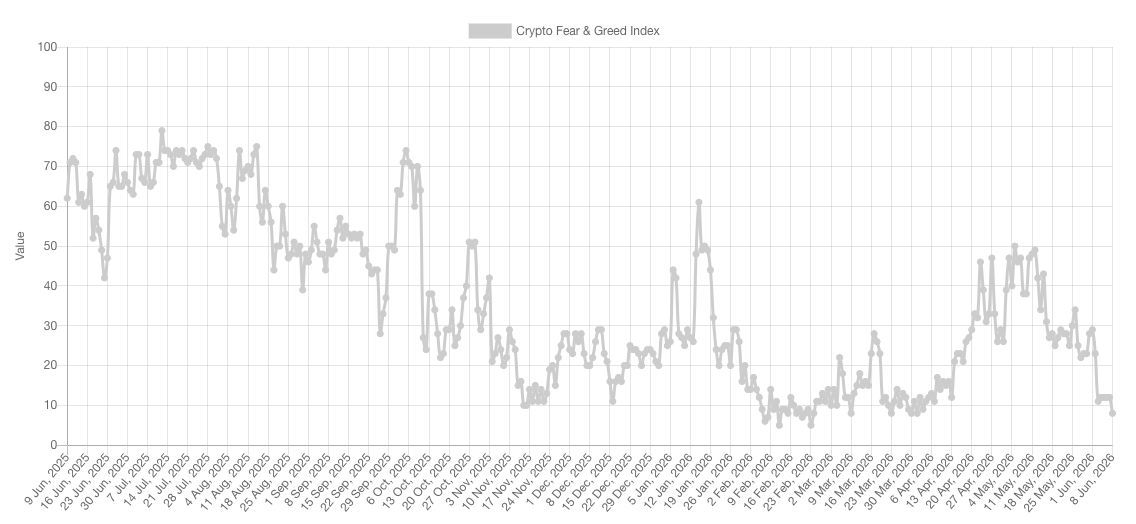
Crypto Fear & Greed Index (screenshot). Source: Alternative.me
After tracking social media trends, analytics firm Santiment observed the “highest degree of negativity since mid-February.”
“Historically, such moments of widespread despair have frequently coincided with market bottoms,” the team shared with X followers.
“When traders begin pronouncing an asset class ‘dead,’ particularly one as speculation-heavy as crypto, it usually indicates that a large portion of sellers have already parted with their holdings, leaving little remaining supply capable of pushing prices meaningfully lower.”
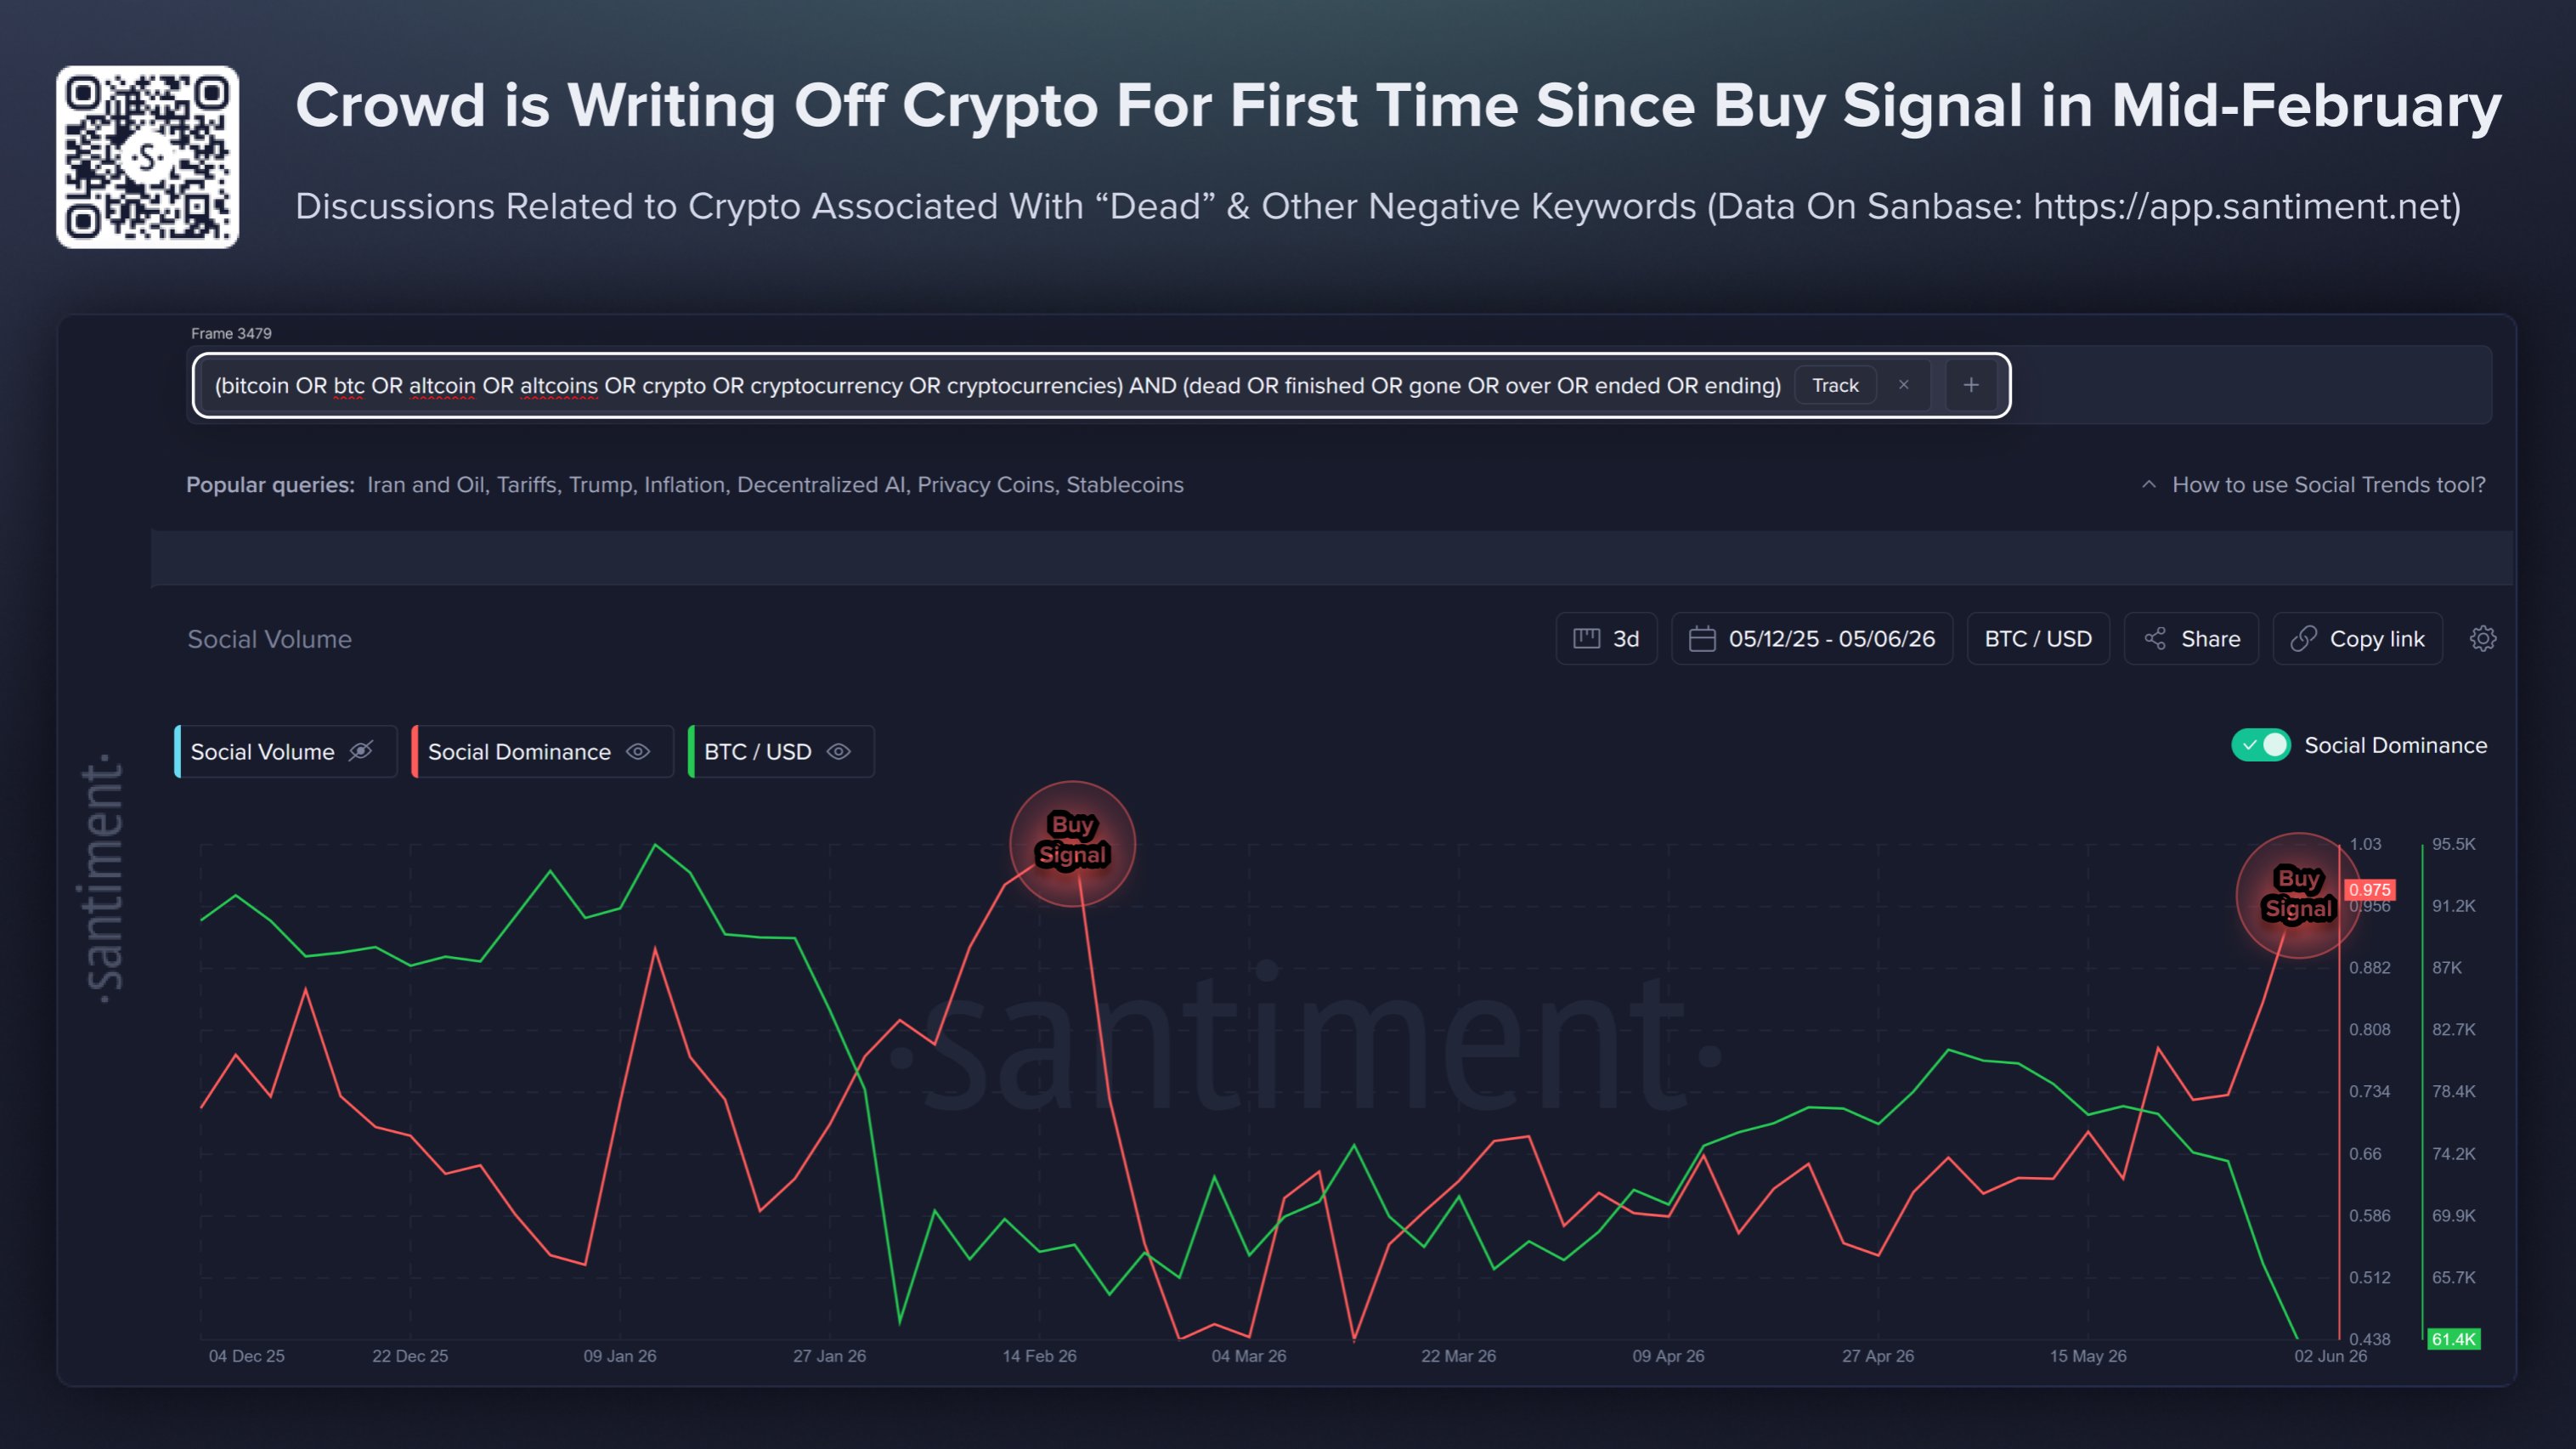
Crypto sentiment data. Source: Santiment/X
Back in February, when the $60,000 level re-entered the picture, a similar sentiment collapse set the stage for a recovery to the mid-$70,000 range.
“Although sentiment on its own cannot pinpoint exact turning points, historical tendencies suggest that stretches where investors are most convinced crypto is ‘over’ have often presented favorable opportunities for patient traders willing to lean against the prevailing crowd psychology,” Santiment concluded.