



# ConvexGating: A Novel Automated Approach for High-Dimensional Cell Population Gating in Cytometry
## Introduction
High-dimensional cytometry, including both traditional flow cytometry and mass cytometry (cyTOF), generates complex datasets where individual cells are characterized by dozens of molecular markers simultaneously. Extracting meaningful biological insights from these experiments requires a critical preprocessing step known as gating—the process of identifying and isolating specific cell populations of interest from a heterogeneous mixture. For decades, this task has relied heavily on manual gating performed by trained operators using visualization software, a process that is time-consuming, subjective, and prone to inter-operator variability.
Automated gating methods have emerged to address these limitations, offering reproducible and scalable alternatives for cell population identification. Among these, ConvexGating represents a newly developed computational framework designed to learn interpretable gating strategies that closely mimic the decision-making process of experienced cytometrists. This article explores the methodology, performance characteristics, and practical applications of ConvexGating across diverse experimental contexts.
## The Challenge of Cell Population Identification
In a typical flow cytometry experiment, researchers stain cells with fluorescently labeled antibodies targeting specific surface and intracellular markers. Each cell passes through a laser beam and emits light proportional to the expression of each marker, generating a multidimensional data point for every individual cell. The goal of gating is to define regions in this high-dimensional marker space that correspond to specific cell types—such as T cells, B cells, monocytes, or dendritic cell subsets.
Manual gating typically proceeds through a hierarchical decision tree, where operators first identify broad populations (e.g., lymphocytes vs. monocytes) and then subdivide them into finer categories using successive two-dimensional scatter plots. While effective, this approach suffers from several well-documented limitations: operator fatigue, inconsistent application of gating criteria across experiments, and difficulty in reproducing results across laboratories and time points.
## ConvexGating: Core Principles
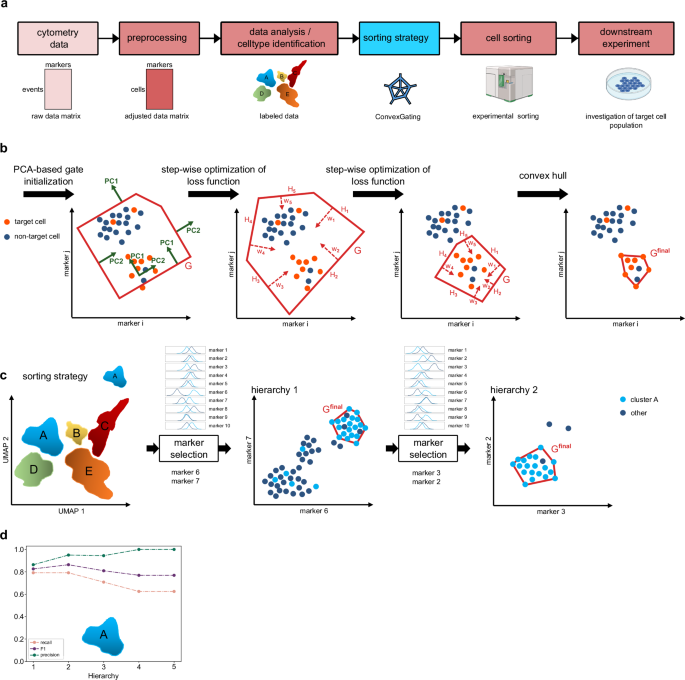
ConvexGating is an algorithmic framework that learns gating strategies directly from labeled training data. The central idea is to construct a convex polygonal region in marker space that optimally encloses a target cell population while excluding non-target cells. This approach is motivated by the observation that human experts tend to draw approximately convex boundaries around cell populations when performing manual gating in two-dimensional dot plots.
The algorithm operates hierarchically, learning one gate at a time for each level of the annotation hierarchy. At each level, it identifies the two most informative markers for separating the target from non-target populations, defines an initial gate location through optimization, and then refines the boundary using a convex hull operation. The result is a sequence of polygonal gates that can be applied consistently to new datasets.
### Marker Selection
The first step in constructing a gating strategy involves identifying which markers provide the best separation between target and non-target populations. ConvexGating employs a heuristic approach based on the statistical distributions of marker expression. Specifically, for each marker, it calculates the first, fiftieth, and ninety-ninth percentiles of expression in both the target and non-target populations. It then computes a score reflecting the difference between these distributions, selecting the pair of markers with the highest discriminative power.
An alternative marker selection approach uses supervised classifier-based methods, such as decision trees or linear support vector machines, to rank markers by their individual ability to separate the two populations. The top two markers from either method are chosen to define the two-dimensional space in which the gate will be constructed.
### Gate Learning Through Optimization
Once the two markers are selected, ConvexGating defines the gate as the intersection of multiple half-spaces in the two-dimensional marker space. Each half-space is determined by a linear boundary (a hyperplane in 2D), and the combination of these boundaries forms a convex polygon. The parameters of each boundary—the orientation (normal vector) and position (bias)—are optimized through stochastic gradient descent to minimize a weighted binary cross-entropy loss function.
The loss function is designed to penalize misclassification of target cells and non-target cells asymmetrically. When target cells are rare compared to non-target cells (a common scenario in cytometry), the algorithm automatically adjusts the weighting to ensure that the minority population receives appropriate attention during optimization. Two regularization terms further refine the gate by encouraging it to remain tightly clustered around the centroid of the target population and to be robust against outlier cells.
### Convex Hull Refinement
After the initial optimization step produces a candidate gate, ConvexGating applies a convex hull operation to tighten the boundary. The convex hull is the smallest convex polygon that contains all target cells identified within the candidate gate. This final step removes any non-target cells that fall within the initial but overly expansive gate, while ensuring that no target cells are excluded. The resulting gate is both compact and interpretable, making it suitable for downstream applications such as cell sorting.
## Experimental Validation and Datasets
The ConvexGating framework was validated across a diverse collection of cytometry datasets spanning different instruments, species, and biological contexts.
### Flow Cytometry Datasets
One validation dataset comprised peripheral blood samples from healthy human donors, stained with an antibody panel targeting monocytes and conventional dendritic cell type 2 (cDC2) subsets. The panel included markers such as CD1c, CD5, CD14, CD16, HLA-DR, CD19, and CD20, enabling the identification of major immune cell populations. Additionally, a larger panel with 27 markers was used to profile peripheral blood mononuclear cells (PBMCs) from healthy donors, covering all major immune cell lineages including B cells, T cell subsets (CD4+, CD8+, NKT cells), NK cells, monocyte subtypes (classical, non-classical, intermediate), and dendritic cell subtypes (plasmacytoid and conventional).
### Mass Cytometry (cyTOF) Datasets
A publicly available mass cytometry dataset of human bone marrow from healthy donors was employed to evaluate ConvexGating in the context of higher-dimensional data. This dataset enabled annotation across multiple hierarchical levels, from broad lineages (NK cells and T cells) to more refined T cell subtypes. Another cyTOF dataset from COVID-19 patients provided a clinically relevant test case, focusing on the identification of CD16+ T cell populations within both CD4 and CD8 compartments.
### Single-Cell RNA Sequencing Data
To complement the cytometry validation, ConvexGating was assessed alongside single-cell RNA sequencing experiments performed using the FLASH-seq technology. These experiments profiled CD8 T cell subsets (naive and TEMRA cells) from healthy human donors, as well as adipocyte precursor subpopulations from mouse white adipose tissue of high-fat diet-fed animals. The integration of flow cytometry index sorting data with transcriptomic profiles enabled protein-level validation of cell type assignments.
### Manual Gating Benchmark
To establish a reference standard for comparison, a manual gating task was designed in which nine participants (seven unique operators) independently gated immune cell populations from a 27-marker PBMC dataset. The participants ranged in experience but all had training in flow cytometry analysis using FlowJo software. The resulting annotations were compared against the original study’s cell type definitions (the “Gold standard”) and against each other to quantify inter-operator variability using metrics such as the Jaccard index, normalized mutual information, and inverse Simpson index.
## Benchmarking Against Existing Methods
ConvexGating was systematically compared against several state-of-the-art automated gating approaches. Hypergate, a widely used method that fits high-dimensional rectangles to separate target cells from non-target cells, served as the primary comparator. Hypergate projects the high-dimensional rectangle into two-dimensional space to derive marker-based gating strategies that are compatible with traditional flow cytometry visualization.
In addition, two supervised binary classification algorithms were benchmarked: a linear support vector machine (SVM) and a radial basis function (RBF) kernel SVM. While these classifiers can accurately distinguish target from non-target cells, their outputs do not directly translate into interpretable gating strategies in the way that ConvexGating and Hypergate do. The linear SVM searches for a single separating hyperplane in the full marker space, while the RBF SVM employs a nonlinear kernel transformation that can capture more complex decision boundaries but at the cost of reduced interpretability.
The benchmark was conducted across multiple datasets with varying annotation granularities, from two annotation levels (broad cell types) to five annotation levels (highly refined subtypes). Performance was evaluated using precision, recall, and the F1 score, which represents the harmonic mean of precision and recall.
## Performance Evaluation Metrics
The quality of a gating strategy is assessed through three complementary metrics:
**Recall** measures the proportion of true target cells that are correctly captured by the gating strategy. A high recall indicates that the algorithm identifies most cells belonging to the population of interest, minimizing false negatives.
**Precision** quantifies the purity of the gated population—the fraction of cells within the gate that truly belong to the target population. High precision is particularly important for applications such as fluorescence-activated cell sorting (FACS), where downstream functional assays require a highly enriched cell population.
**F1 Score** combines precision and recall into a single metric. Because F1 is the harmonic mean, it penalizes extreme imbalances between precision and recall, encouraging gating strategies that perform well on both dimensions simultaneously. By default, ConvexGating optimizes for F1 with an emphasis on precision, reflecting the practical importance of cell population purity.
## Data Processing Pipeline
The analysis workflow incorporating ConvexGating follows a structured pipeline designed to ensure reproducibility and transparency. Flow cytometry data in FCS format is first loaded and converted into a unified data structure (anndata format). Compensation is applied to correct for fluorescent spillover between detection channels, followed by transformation of the data using a bi-exponential function that normalizes the dynamic range of marker intensities.
After preprocessing, cell populations are identified through either manual gating (for reference annotations) or automated methods including Leiden clustering (a graph-based community detection algorithm) and ConvexGating. The clustering and gating results are visualized using uniform manifold approximation and projection (UMAP), a dimensionality reduction technique that preserves local structure in high-dimensional data.
For the single-cell RNA sequencing data, raw sequencing reads were pseudoaligned to the reference transcriptome, and transcript abundance was quantified. Gene expression matrices were normalized and log-transformed before performing unsupervised clustering and differential expression analysis. Protein expression data from index sorting was integrated with transcriptomic profiles to enable multi-modal cell characterization.
## Contour-Based Visualization of Gating Strategies
To facilitate the interpretation and communication of learned gating strategies, ConvexGating generates contour-based density visualizations. For each hierarchy level in the gating strategy, two-dimensional histograms of target and non-target populations are constructed in the relevant marker space. Gaussian smoothing is then applied to produce continuous density estimates, with contour levels adaptively selected based on population size. This approach enables clear visualization of how the learned gate separates target from non-target cells, even in datasets containing tens of thousands of events.
## Applications and Broader Impact
The ConvexGating framework addresses several practical challenges in modern cytometry research. By automating the gating process, it reduces the time required for data analysis and eliminates a major source of inter-experiment variability. The interpretability of the learned gates—they are expressed as simple polygonal boundaries in marker space—makes them compatible with downstream analytical workflows and facilitates quality control.
In clinical contexts, where consistent and reproducible cell population identification is critical for diagnostic accuracy, automated gating methods like ConvexGating offer the potential to standardize analyses across laboratories and patient cohorts. The framework’s ability to handle multiple annotation levels also makes it suitable for studies requiring both broad cell type identification and fine-grained subtype characterization.
The open-source availability of the pytometry package, which incorporates ConvexGating and related analysis tools, further supports widespread adoption and community-driven development of the methodology.
## Frequently Asked Questions (FAQ)
**What types of cytometry data can ConvexGating process?**
ConvexGating is designed to work with both traditional flow cytometry data (measured using fluorescent labels) and mass cytometry data (measured using metal-labeled antibodies detected by time-of-flight mass spectrometry). It has also been applied in conjunction with single-cell RNA sequencing data that includes protein-level measurements from index sorting.
**How does ConvexGating differ from manual gating?**
Manual gating relies on human operators visually inspecting scatter plots and drawing polygonal regions to define cell populations. ConvexGating automates this process by learning gate boundaries from labeled training data using mathematical optimization. The resulting gates are reproducible, objective, and can be applied consistently across large numbers of samples.
**Is ConvexGating a black-box method?**
No. Unlike some machine learning approaches that produce complex, difficult-to-interpret models, ConvexGating generates gates that are expressed as intersections of simple linear boundaries in marker space. Each gate corresponds to a polygonal region that can be visualized in traditional two-dimensional scatter plots, making the decision process transparent and auditable.
**What is the role of the training data?**
ConvexGating requires a training dataset in which cells have been labeled with their correct cell type assignments. These labels can come from manual gating by an expert, from prior clustering results, or from known biological markers. The algorithm uses these labels to learn which markers best distinguish each population and where the boundaries between populations should lie.
**Can ConvexGating handle rare cell populations?**
Yes. The algorithm incorporates a weighted loss function that automatically adjusts the balance between target and non-target cells based on their relative frequencies. This ensures that rare populations—which are often the most biologically interesting—receive appropriate attention during gate optimization.
**How does ConvexGating compare to Hypergate?**
Both ConvexGating and Hypergate aim to produce interpretable gating strategies from high-dimensional cytometry data. Hypergate uses a rectangle-based approach, fitting a high-dimensional box around the target population. ConvexGating uses a convex polygon, which can better capture irregularly shaped populations. In benchmark comparisons, ConvexGating demonstrated competitive or superior performance across multiple datasets and annotation levels.
**What software is required to use ConvexGating?**
ConvexGating is implemented in Python and is available as part of the pytometry package. It depends on standard scientific computing libraries including scanpy, anndata, and scikit-learn. All code and data used in validation studies are publicly available.
**Can ConvexGating be used for cell sorting?**
Yes. The gating strategies produced by ConvexGating are compatible with fluorescence-activated cell sorting (FACS) instruments. Because the gates are defined by simple polygonal boundaries in marker space, they can be directly translated into sort commands on standard cytometers.
## Conclusion
The ConvexGating framework represents a significant advancement in automated gating for high-dimensional cytometry data. By combining interpretable geometric gate representations with principled statistical optimization, it bridges the gap between the accuracy of machine learning approaches and the transparency required for scientific reproducibility. Validation across multiple cytometry modalities, species, and biological contexts—from healthy donor peripheral blood to COVID-19 patient samples to mouse adipose tissue—demonstrates the versatility and robustness of the method.
The ability to learn gating strategies that are both accurate and interpretable addresses a critical need in cytometry research, where the increasing dimensionality of modern panels demands automated solutions that do not sacrifice biological insight for computational convenience. As cytometry technologies continue to evolve and the scale of experiments grows, tools like ConvexGating will play an increasingly important role in enabling researchers to extract reliable, reproducible biological conclusions from their data.
The availability of the pytometry package as an open-source resource further ensures that the community can adopt, extend, and contribute to the continued development of this methodology.
Thank you for reading
