



**The Hidden Cost of Peeking: Why Early Stops Inflate A/B Test Results**
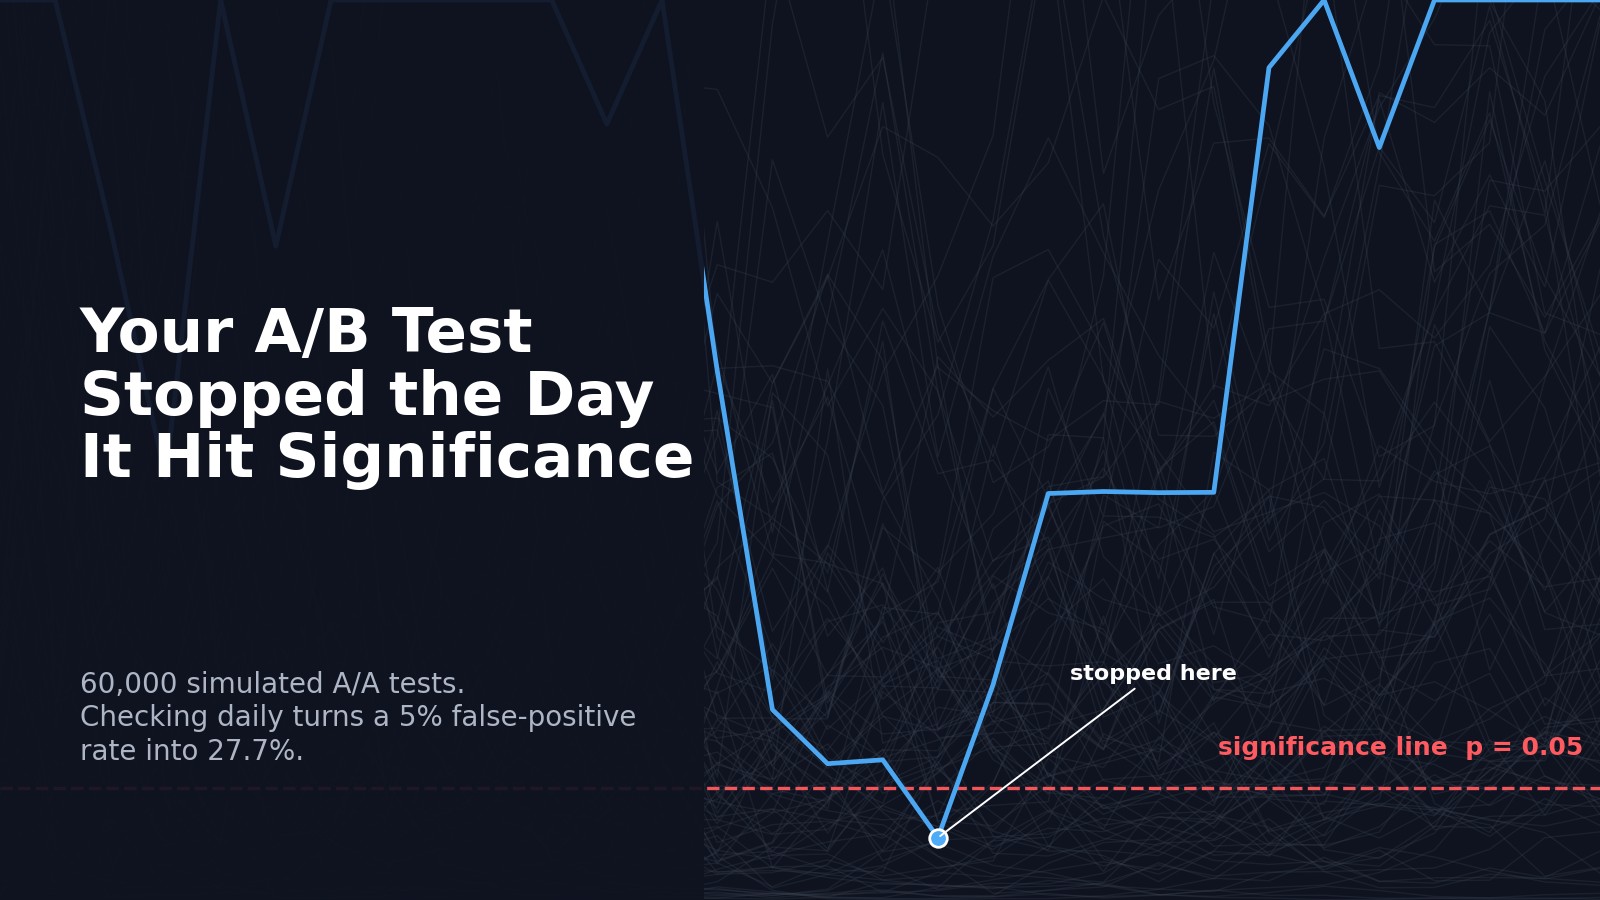
In many A/B testing guides, the recipe is straightforward: define your hypothesis, pick a metric, run a two-proportion z-test, and treat the result as official when the p-value drops below 0.05. Teams often follow this routine diligently—checking dashboards each morning, waiting for that clean “significant” signal. But while the steps seem simple, a common practice quietly undermines the validity of the results: checking the test repeatedly before it’s finished and stopping as soon as p < 0.05.The problem isn’t carelessness—it’s statistics. The 5% false-positive rate promised by a standard test is only guaranteed when you look exactly once, at a single, pre-chosen endpoint. Every additional glance at the dashboard gives randomness another chance to produce a misleadingly “significant” result.**The Cost of Repeated Looks**To illustrate this, we simulated an A/A test—two identical groups with a true 10% conversion rate—over 30 days with 1,000 visitors per arm per day. Using a two-proportion z-test at the 5% level, we compared outcomes under different monitoring strategies:- **One final look**: The false-positive rate held near 5%, as expected. - **Daily peeks for 30 days**: The false-positive rate jumped to **27.7%**.In other words, more than a quarter of “wins” were artifacts of the stopping rule, not real effects.Among tests that crossed the 0.05 threshold at least once, half did so by day five—a point where sample sizes are still small and estimates are highly unstable. When teams stop at the first sign of significance, they are often capturing noise, not signal.**Real Winners Get Exaggerated Too**Even when there is a genuine effect, repeated peeking distorts the results. In a second simulation, we gave variant B a true 10% lift over A (10% vs. 11% conversion). A fixed-horizon test estimated a median lift close to the true 10%. But a test stopped at the first significant moment reported a **median lift of 12.7%**—a substantial overstatement caused by early extreme swings.This “winner’s curse” matters because early lift estimates are often used for forecasting, prioritization, and stakeholder decisions. An overstated lift can lead to misplaced confidence, misallocated resources, and disappointing post-rollout performance.**Practical Ways to Allow Early Peeking**The solution isn’t to stop observing data—it’s to align the analysis method with actual behavior. Three approaches offer valid ways to peek early:1. **Fixed-sample, no peeking** Commit to a single endpoint. This keeps the false-positive rate at about 5.1% and is the simplest valid approach, but it requires patience and forgoes early insights.2. **Group-sequential (Pocock) boundaries** Predefine multiple look points and apply a stricter threshold at each one. With daily monitoring, a Pocock boundary with a z-cutoff of 2.73 (instead of 1.96) maintains a false-positive rate near 4.9% and detects true effects earlier—around day 11 on average.3. **Always-valid p-values** Designed for ongoing monitoring, these methods remain valid no matter when or how often you check. In our simulation, they held the false-positive rate at roughly 1.5% and delivered decisions by day 14, though with slightly lower power than group-sequential methods.Each approach involves clear tradeoffs between speed, rigor, and conservativeness. The key insight is that **early stopping must be built into the design**, not patched onto a fixed-sample routine.**Limitations and Real-World Considerations**The simulation reflects idealized conditions: one metric, clean randomization, and steady traffic. Real programs often test multiple metrics, multiple variants, and user segments, which increases multiplicity risk. Seasonal patterns, novelty effects, and practical constraints may also justify minimum runtimes beyond what pure sequential methods require. Techniques like CUPED can complement sequential testing by reducing variance, but they do not solve the peeking problem.**Conclusion: Make Peeking Part of the Design**A/B testing dashboards are not temptations to be resisted—they are tools to be designed with. The act of checking results is not the problem; treating early, informal looks as if they were a single fixed test is. By choosing a stopping rule and significance method that match how you actually monitor experiments, teams can preserve both scientific validity and the speed that makes experimentation valuable. The next A/B testing guide should make this explicit: specify the stopping rule up front, choose a method that covers it, and report how—and when—the decision was made. Only then can a p-value truly mean what it claims.
