


Bitcoin (BTC) rose 3.5% over the past week, reaching $81,325 on Tuesday — its highest point since January. But the question on traders’ minds is whether this represents just a temporary rally within a broader bear market or the beginning of a new “supercycle,” as some analysts believe.
Main highlights:
- Bitcoin could surge to $180,000–$200,000 as large-scale institutional buying counteracts bear-market selling pressure
- Strong resistance continues to hold around the $80,000–$82,000 price zone.
BTC/USD daily price chart. Source: TradingView
Bitcoin “supercycle” theory points to $250,000 ahead
Bitcoin has now recovered 35.70% from its February low of $59,930. However, it still sits about 36% below its October 2025 all-time high near $126,200. This gap has fueled disagreement among market participants, with some forecasting a return to record highs before the year is out.
According to analyst PlanC, Bitcoin is not following a standard boom-and-bust pattern but is instead entering its first-ever “supercycle.”
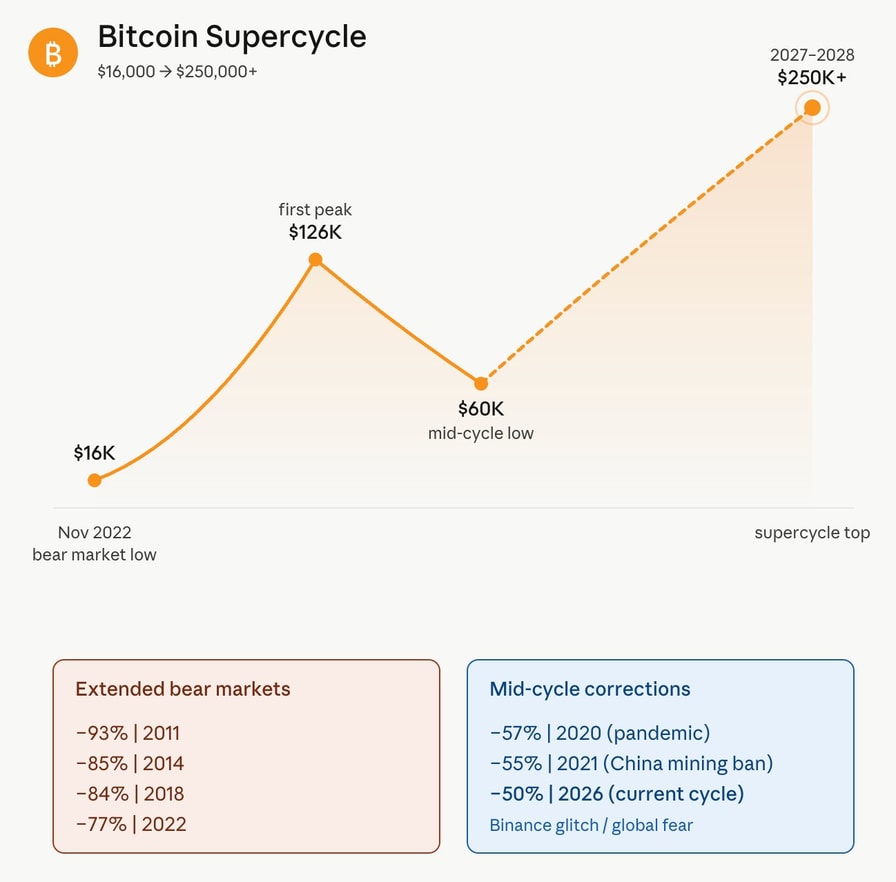
In a Tuesday post, he outlined a path toward $250,000 or higher by 2027–2028, measured from the $16,000 bear-market bottom in November 2022.
His model divides the current cycle into three stages: an initial surge to $126,000 (already completed), a mid-cycle pullback toward $60,000 (also completed), and a final expansion phase aimed at pushing past $250,000 to new all-time highs.
Bitcoin supercycle illustration. Source: PlanC
He emphasized that the recent ~50% decline looks more like the mid-cycle resets seen in 2020 and 2021, rather than the severe 70%–90% bear markets experienced in 2014, 2018, and 2022.
In the current environment, institutional demand is soaking up more than 500% of the newly mined daily BTC supply, which is turning what used to be sharp crashes into milder pullbacks.
That said, the entire thesis depends on Bitcoin maintaining support above its mid-cycle floor near $60,000. A decisive break below that level would undermine the supercycle argument and revive the possibility of an extended bear phase.
“I think once BTC clears the mid-80s and holds, the chances of seeing new highs are quite high,” analyst Pentoshi wrote in a Tuesday post, pointing to the ongoing supply squeeze.
He continued:
“In terms of probabilities, I think the lows are in and we could see BTC trade as high as $180k between this year and next.”
Elliott Wave analysis suggests Bitcoin’s bottom may already be in place
Bitcoin’s recent recovery has added weight to the argument that its correction from the January 2025 peak is over, based on trader Decode’s Elliott Wave framework.
The chart indicates BTC has likely finished a three-wave A-B-C correction, with the final “C” wave finding a bottom near $60,000. In Elliott Wave theory, this typically signals the end of a corrective period and can set the stage for a fresh five-wave rally.
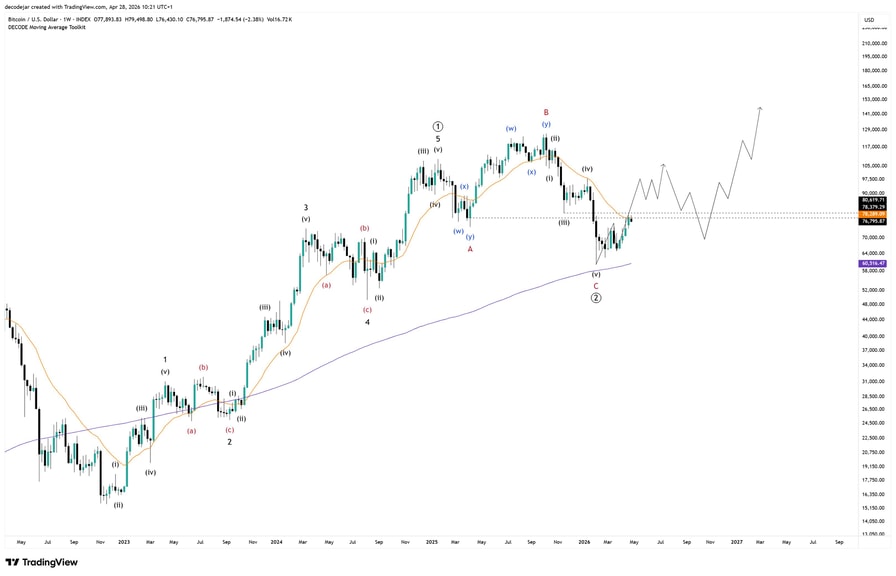
BTC/USD weekly chart. Source: TradingView/Decode
Decode points out that Bitcoin has now climbed back above its November low, even if only marginally. This overlap rules out bearish wave counts that anticipated “one more low” within the same downward move.
As a result, the bearish outlook has weakened. BTC
The recent drop to around $60,000 may have marked a cycle low, though it could still be part of a broader corrective phase. The cleaner technical structure now supports this possibility.
If Bitcoin decisively reclaims the $78,000–$80,000 zone as support, it would significantly increase the likelihood of a rally toward the $90,000–$100,000 range in the near term.
Sellers emerge at a critical resistance zone
Bitcoin’s recovery is encountering a well-known cluster of resistance levels, raising the potential for a short-term pullback.
As of Tuesday, BTC is challenging the combined resistance of its 200-day exponential moving average (200-day EMA, shown in blue) and the upper boundary of a bear flag pattern near the $80,000–$82,000 area.
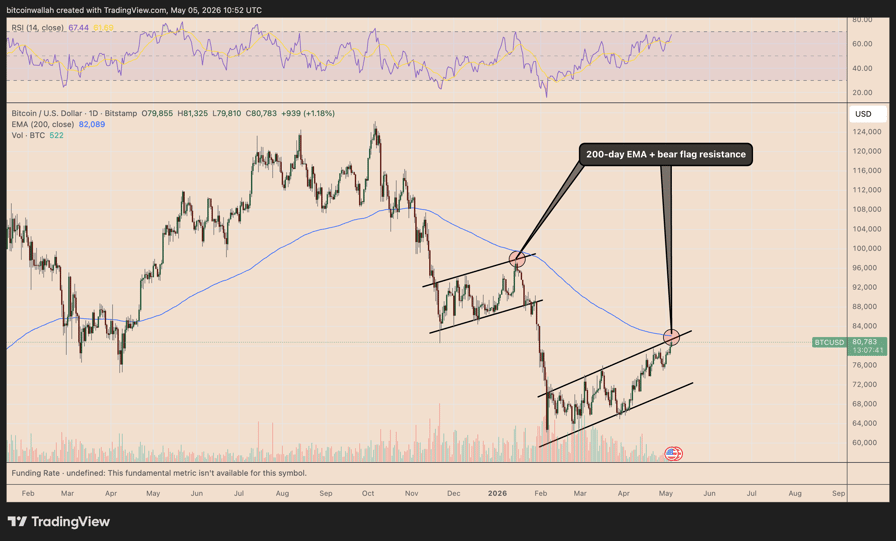
BTC/USD daily chart. Source: TradingView
This confluence of resistance raises the probability of a Bitcoin pullback in the coming days, with a likely downside target near the lower trendline of the bear flag around $70,000–$72,000.
A break below the bear flag’s lower boundary could push the price below $50,000.
A similar scenario unfolded in January: Bitcoin rallied toward its 200-day EMA after a prolonged decline but failed to break through. The rejection led to another downward move before a more sustainable bottom eventually took shape.
Historically, the 200-day EMA has acted as strong resistance during bear market rallies—particularly in 2018 and 2022—as noted in a chart shared by analyst Jason Pizzino.
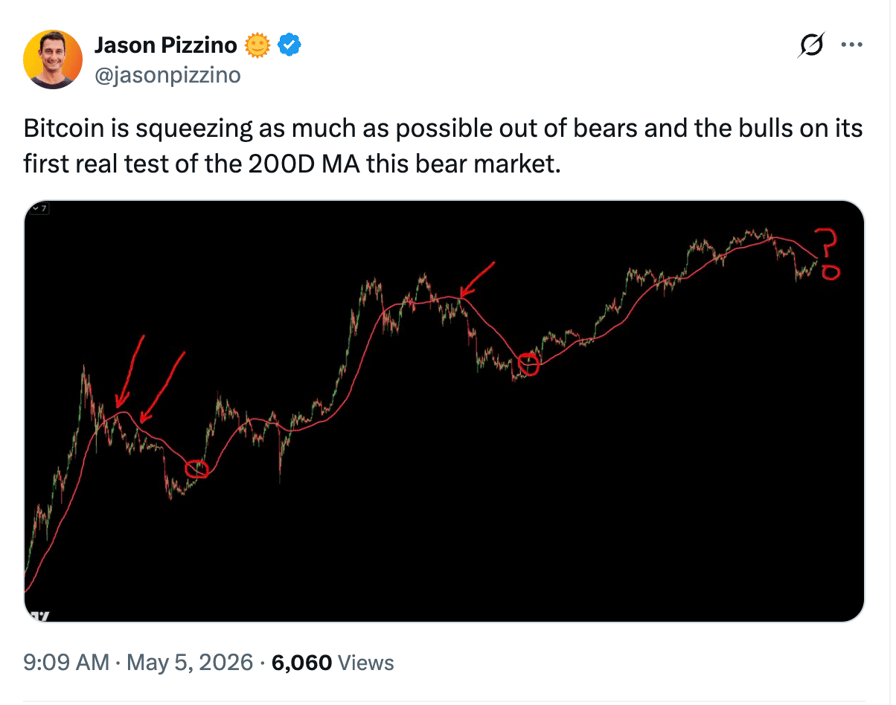
Source: X
During the 2018 bear market, Bitcoin’s price fell by an average of 40% after testing the 200-day EMA as resistance. In 2022, the average decline was approximately 35.5%.
Related: Bitcoin short-term cost basis approaches profitability, but $80K must flip to support first
If history repeats, BTC could drop to the $48,000–$52,000 range—a level that aligns with the bear flag’s projected downside target.