



# Leveraging Deep Learning for Automated Detection of Neurofibrillary Tangles in Alzheimer’s Disease Brain Tissue
## Introduction
Alzheimer’s disease remains one of the most challenging neurodegenerative disorders to diagnose and characterize with precision. Among the hallmark pathological features of the disease are neurofibrillary tangles (NFTs), which are aggregates of hyperphosphorylated tau protein that accumulate inside neurons. Quantifying these tangles in post-mortem brain tissue has traditionally relied on labor-intensive manual assessment by expert neuropathologists, a process that is both time-consuming and subject to inter-observer variability.
Recent advances in artificial intelligence, particularly in the domain of computer vision, have opened new possibilities for automating the detection and quantification of pathological features in medical imaging. Whole slide imaging (WSI) technology now allows researchers to digitize entire histological slides at high resolution, creating massive datasets that are ideal for training machine learning models. However, the development of robust deep learning pipelines for neurological tissue analysis requires careful attention to data curation, annotation quality, and model validation.
This article explores the development and validation of an automated NFT detection system that combines semantic segmentation with object detection approaches. The work demonstrates how a carefully curated dataset of annotated brain tissue slides can be used to train models that not only identify NFTs with high accuracy but also produce quantitative scores that correlate with expert pathological assessments.
## Building a High-Quality Training Dataset
### Tissue Acquisition and Cohort Selection
The foundation of any successful machine learning project in pathology lies in the quality of the underlying data. The study drew de-identified autopsy brain tissue samples from three distinct Alzheimer’s Disease Research Centers (ADRCs): the University of California Davis, Columbia University, and the University of California San Diego. All tissue samples were obtained in compliance with HIPAA regulations and institutional review board protocols.
From a pool of 295 collected cases, a subset of 22 cases was selected for the training and validation batches, with an additional 24 cases held out for external validation. The selection followed standardized inclusion criteria requiring that all cases met the pathological criteria for Alzheimer’s disease as defined by NIA Reagan or NIA-AA intermediate/high criteria. Cases were randomly sampled across three ADRCs, with stratification by gender and ethnicity to ensure demographic diversity within the dataset.
### Histological Processing and Slide Preparation
Temporal cortex sections, sliced at 5–7 μm thickness from formalin-fixed paraffin-embedded (FFPE) tissue blocks, served as the substrate for analysis. Each ADRC prepared its own FFPE sections, which were then shipped unstained to a central laboratory at the University of California Davis for immunostaining. This centralized staining approach was deliberately chosen to minimize batch effects that could introduce variability into the model training process.
The AT8 antibody, which specifically targets phosphorylated tau protein, was applied at a dilution of 1:1000. Following antibody incubation and development with diaminobenzidine (DAB), all slides were digitized using a Zeiss Axio Scan Z.1 microscope at 40× magnification, yielding whole slide images with a resolution of 0.11 μm per pixel and saved in the proprietary Carl Zeiss (.CZI) format.
### Semi-Quantitative Expert Assessment
Before any machine learning work began, an expert neuropathologist performed semi-quantitative histopathological assessments of NFTs on each WSI, blinded to all demographic, clinical, and genetic information. Using the established CERAD protocol, the pathologist evaluated the densest 1 mm² area of each WSI and assigned a categorical severity score: none (no NFTs present), sparse (0–5 NFTs), moderate (6–20 NFTs), or frequent (greater than 20 NFTs). These scores served as the ground truth reference against which model outputs would later be compared.
## Annotation Pipeline and Data Preparation
### Region of Interest Identification and Point Annotation
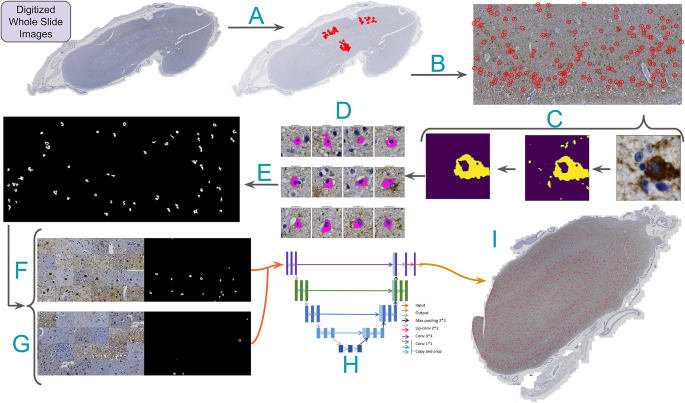
The annotation process began with the identification of three regions of interest (ROIs) per WSI using Zen Blue 3.2 software. Each ROI measured approximately 10,680 × 21,236 pixels and spanned either the cortical gray matter or the gray matter–white matter junction. A trained annotator systematically scanned each ROI, marking mature neurofibrillary tangles that exhibited specific morphological criteria: flame-shaped morphology, a clearly defined nucleolus, complete AT8 staining filling the cell body, and smooth boundaries with 1–2 protrusions. The NFT was marked at the nucleolus position only if all criteria were satisfied.
In total, 1,476 NFTs were annotated across 74 ROIs in the initial annotation pass. The focus on mature tangles with clearly visible nucleoli was a deliberate choice to ensure consistency and to provide unambiguous training targets for the subsequent deep learning models.
### Data Format Conversion and ROI Correction
The proprietary Carl Zeiss image format was converted to the open-source Zarr format to facilitate efficient data handling in downstream analysis pipelines. During this conversion, a lossless Blosc-zstd compressor was employed to optimize read and write speeds, which proved critical for the computationally intensive segmentation tasks that followed.
A significant technical challenge arose from the fact that annotated ROIs were not necessarily aligned with the edges of the digitized slide images. To address this, the team implemented a rotation correction procedure that first isolated the minimum inscribing region around each rotated ROI and then applied geometric transformation to crop it to a standard orientation. Each corrected ROI was stored as a Zarr file with its spatial coordinates preserved in a custom Python annotation object.
### Converting Point Annotations to Segmentation Masks
Training a semantic segmentation model requires pixel-level ground truth labels rather than simple point annotations. The team developed a procedural pipeline that bootstrapped point annotations into binary segmentation masks. For each annotated NFT, a 400 × 400 pixel tile was cropped and centered around the point label, with boundary tiles padded to ensure consistent centering.
The pipeline involved color deconvolution to separate the DAB signal from the hematoxylin counterstain, followed by Otsu thresholding to binarize the image and isolate AT8-positive tissue. Morphological opening and closing operations were then applied to clean up noise and fill gaps in the segmented regions. A critical innovation was the introduction of a “center bias” algorithm that favored the contiguous region closest to the tile center, effectively resolving ambiguities when multiple NFTs or background staining artifacts were present in a single tile. The largest remaining blob above a size threshold was retained as the ground truth NFT mask.
These individual tile masks were then stitched back together using union operations to reconstruct complete ROI-level segmentation maps, providing detailed pixel-boundary labels for every NFT in the dataset.
## Model Development and Training
### Segmentation Model Architecture
The core of the detection pipeline was a U-Net architecture with a ResNet50 encoder pre-trained on ImageNet. After evaluating several alternative backbone networks and encoder variants, the team found that the U-Net with ResNet50 offered the best balance of performance and computational efficiency. The model was trained using 10-fold cross-validation, with each fold splitting the dataset into 80% training and 20% hold-out testing, further subdivided into training and validation subsets.
To address the inherent class imbalance in the data — where NFT pixels constituted a small fraction of each tile — the team employed a weighted random sampling strategy during training that maintained a 50/50 balance between NFT-containing tiles and empty tiles. This approach ensured that the model was exposed to meaningful examples of both classes in every training batch.
### Loss Function and Hyperparameter Optimization
The choice of loss function proved critical given the extreme imbalance between positive (NFT) and negative (background) pixels. The team selected Tversky loss, which allows asymmetric weighting of false negatives and false positives through its alpha and beta parameters. Hyperparameter optimization was conducted using Bayesian optimization with Weights and Biases sweeps, exploring learning rates, weight decay, optimizer configurations, and Tversky loss parameters.
Training was distributed across two NVIDIA RTX 3090 GPUs using PyTorch Lightning’s data-parallel framework, with Kornia’s geometric and color augmentation procedures applied dynamically during training to improve generalization. Augmentations included random rotations, flips, affine transformations, and color jitter, all applied differently to images and their corresponding masks.
### Key Performance Metrics
Model evaluation was conducted at multiple levels of granularity: individual NFTs (object level), 1024 × 1024 pixel tiles, ROIs, and whole slide images. Primary metrics included F1 score (equivalent to the Dice coefficient for binary segmentation), mean intersection over union (mIOU), and positive IOU. At the tile level, a random baseline F1 was established using the positive pixel prevalence of 0.000898 in the test set.
## Re-Annotation and Model Refinement
### Identifying Ground Truth Errors Through Model Feedback
An important finding emerged during the initial evaluation phase. When the team constructed agreement maps — pixel-level comparisons between model predictions and ground truth annotations — they observed a substantial number of false positive predictions across the dataset. Careful examination of these false positive regions revealed that many contained morphologically plausible NFTs that had been missed during the initial annotation round by the trained novice annotator.
### Expert Re-Annotation
To stress-test and improve the quality of the ground truth data, the team initiated a systematic re-annotation experiment. The expert neuropathologist reviewed all ROIs by examining large “super-tiles” (4247 × 3560 pixels) through the SuperAnnotate platform. The workflow presented each super-tile alongside its corresponding agreement map, highlighting areas where the model had made predictions that diverged from the original annotations.
The expert focused specifically on identifying missed NFTs (previously labeled as false positives or true negatives) and added new point annotations for any objects meeting the established NFT criteria. Importantly, no existing annotations were removed during this process. In total, 280 new point annotations were added across 17 WSIs — representing a 19% increase in the annotation volume — completed in less than 90 minutes by the expert.
### Impact on Model Performance
After retraining the segmentation model with the re-annotated ground truth data, significant improvements were observed at the ROI level. Both F1 scores and mean IOU improved, with qualitative analysis of the agreement maps revealing markedly reduced false positive rates. The re-annotation experiment served a dual purpose: it not only improved the dataset quality but also validated the utility of model-generated feedback as a mechanism for identifying and correcting annotation errors.
## Quantitative Evaluation and Correlation with Expert Assessment
### NFTDetector Score Generation
To bridge the gap between pixel-level model outputs and the slide-level semi-quantitative assessments used by expert pathologists, the team developed a score called the NFTDetector score. This score was generated by running the trained segmentation model across entire WSIs using a sliding window approach, counting the total number of contiguous detected NFT regions, and normalizing by the detected tissue area. The scores were further rescaled by the median tissue area of the training set to produce interpretable, comparable values.
### Correlation with CERAD-like Scores
The NFTDetector scores generated from the model were compared against the expert-assigned CERAD-like semi-quantitative categories (None, Sparse, Moderate, Frequent) using Welch’s t-test. The results demonstrated statistically significant differences between severity categories (p < 0.01 for the comparison between Moderate and Severe categories), indicating that the automated score captures meaningful variation in NFT burden across slides.### Comparison with Manual Annotation CountsTo further validate the approach, the team generated a human analog to the NFTDetector score by directly counting the original point annotations across all ROIs for each WSI and normalizing by ROI tissue area. When compared against the model-derived scores, the correlation was strong, confirming that the automated system produces burden estimates consistent with manual annotation counts.## Object Detection Approach with YOLOv8### From Segmentation to Bounding BoxesTo facilitate comparison with prior work and to explore the applicability of object detection frameworks, the team also converted NFT segmentation masks into bounding box annotations. This involved generating contours around each segmented NFT and merging nearby bounding boxes within 150 pixels of each other. Ground truth bounding boxes were derived from the cropped tile views surrounding each point annotation.### Training an YOLOv8 Detection ModelUsing the bounding box annotations, the team trained a YOLOv8 object detection model. Non-overlapping 1024 × 1024 pixel tiles were extracted from the ROIs and saved as static PNG files, with corresponding bounding box coordinates converted to YOLO format. Hyperparameter tuning was conducted using the built-in evolution algorithm with 30 iterations, and the best-performing configuration was reported.### Performance ComparisonThe object detection approach yielded results comparable to the segmentation model at the WSI level. The precision-recall curve demonstrated strong detection capability across confidence thresholds, and WSI-level NFT counts from the YOLOv8 model correlated with the expert CERAD-like semi-quantitative scoring in a manner similar to the segmentation-derived NFTDetector scores. This finding suggests that both approaches are viable for automating NFT quantification in archival brain tissue.## Statistical Framework and Sensitivity AnalysisThe study employed a comprehensive statistical framework operating at four levels of granularity: individual NFTs, tiles, ROIs, and whole slide images. Continuous variables were tested for normality and analyzed using one-way ANOVA or Kruskal-Wallis tests as appropriate, while categorical variables were compared using chi-squared tests.A post hoc sensitivity analysis computed the minimum detectable effect size (MDES) at the ROI level, deriving an effective standard error from the mixed-model confidence intervals for F1 scores. At 80% power and one-tailed α = 0.05, the MDES ranged from 0.11 to 0.12 F1 units. For the WSI-level Spearman correlation analysis, Fisher's z-transformation yielded an MDES of ρ ≥ 0.44 (one-tailed) at 80% power, well below the observed correlation of ρ = 0.654.## Discussion of Broader ImplicationsThe development of automated NFT detection systems carries significant implications for Alzheimer's disease research and neuropathology practice. By dramatically reducing the time required to quantify NFT burden across large datasets, such tools can accelerate studies investigating the relationship between tau pathology and clinical outcomes, genetic risk factors, and therapeutic interventions.The re-annotation experiment also highlights an important paradigm in modern machine learning for medical imaging: the iterative refinement of ground truth data using model feedback. This approach leverages the complementary strengths of human experts and automated systems, where the model identifies regions of uncertainty that warrant expert review, and the expert corrects errors that would otherwise bias the model.Furthermore, the successful conversion of the same annotated dataset for both semantic segmentation and object detection purposes demonstrates the flexibility of the annotation framework. Point annotations, which are simpler and faster to produce than full segmentation masks, can serve as the foundation for multiple model architectures, future-proofing the dataset for evolving computational approaches.## Limitations and Future DirectionsSeveral limitations should be acknowledged. The study was conducted on a relatively modest dataset of 22 training WSIs drawn from three ADRCs, which may limit the generalizability of the findings to other populations, tissue preparation protocols, and staining methods. The focus on temporal cortex tissue, while anatomically relevant for Alzheimer's disease, means the model's performance in other brain regions remains to be established.Additionally, the system was trained and validated exclusively on autopsy tissue from individuals with established Alzheimer's disease pathology. Its applicability to antemortem diagnostic samples, which may contain varying degrees of artifact and tissue quality challenges, represents an important direction for future work.Future efforts could explore multi-center validation with larger and more diverse cohorts, the integration of additional pathological markers beyond tau phosphorylation, and the development of real-time inference systems suitable for clinical deployment. The open-source release of the annotated dataset, model code, and training configurations represents a valuable resource for the broader research community working at the intersection of computational pathology and neurodegenerative disease.## FAQ**What are neurofibrillary tangles and why are they important in Alzheimer's disease?** Neurofibrillary tangles are intracellular aggregates of hyperphosphorylated tau protein that form twisted filaments within neurons. Along with amyloid-beta plaques, they constitute one of the two primary histopathological hallmarks of Alzheimer's disease. The burden and distribution of NFTs correlate with the severity of cognitive impairment and are used to stage disease progression.**How does whole slide imaging work in the context of neuropathology?** Whole slide imaging involves digitizing entire histological glass slides at high magnification using specialized scanner microscopes. This produces extremely high-resolution digital images — often gigapixels in size — that can be viewed, annotated, and analyzed computationally. In this study, WSIs were captured at 40× magnification with a resolution of 0.11 μm per pixel, sufficient to resolve individual NFT structures.**What is the difference between semantic segmentation and object detection in this context?** Semantic segmentation assigns a class label (NFT or background) to every pixel in an image, producing detailed boundary masks for each detected tangle. Object detection, by contrast, identifies NFT instances using bounding boxes — rectangular regions that enclose each tangle. Both approaches can be used to count NFTs and quantify burden, but segmentation provides finer morphological detail while detection may be more forgiving of imperfect boundary alignment.**Why was Tversky loss chosen over other loss functions for training?** Tversky loss is particularly well-suited to highly imbalanced segmentation tasks where the positive class (NFT pixels) constitutes a very small fraction of the total image area. Unlike standard cross-entropy or Dice loss, Tversky loss allows explicit control over the relative penalties for false positives and false negatives through its alpha and beta parameters, enabling the model to prioritize the detection of rare NFT regions.**What is the significance of the re-annotation experiment?** The re-annotation experiment demonstrated that model feedback can be used to identify and correct errors in ground truth annotations, leading to improved dataset quality and better model performance. This iterative approach — where a model highlights uncertain or misclassified regions for expert review — represents a promising paradigm for improving the efficiency and accuracy of pathology annotation workflows.**How long does the automated detection process take compared to manual assessment?** The automated pipeline can process whole slide images significantly faster than manual assessment. While the initial annotation effort required extensive expert time, the trained model can generate NFT counts and burden scores for new WSIs in minutes. The re-annotation of the entire dataset by an expert was completed in less than 90 minutes using the structured review workflow facilitated by the SuperAnnotate platform.**Can this approach be applied to other neurodegenerative diseases?** Yes, the annotation framework and model architecture are general enough to be adapted for detecting pathological features in other neurodegenerative conditions, such as Lewy bodies in Parkinson's disease or amyloid plaques in Alzheimer's disease. The key requirements are high-quality annotated training data and appropriate immunostaining protocols for the target pathology.## ConclusionThe automated detection of neurofibrillary tangles in Alzheimer's disease brain tissue represents a significant step forward in the application of deep learning to computational neuropathology. By combining careful dataset curation, innovative annotation techniques, and robust deep learning architectures, this work demonstrates that machine learning models can achieve quantitative NFT burden estimates that correlate with expert pathological assessments.The integration of semantic segmentation with object detection approaches provides flexibility for different analysis needs, while the iterative re-annotation process highlights the value of using model feedback to refine ground truth data. The open-source release of the annotated dataset, code, and model configurations ensures that these tools can be built upon by the broader research community.As whole slide imaging becomes increasingly commonplace in neuropathology laboratories, automated detection systems will play an ever more important role in quantifying neurodegenerative pathology at scale. The work presented here provides a robust foundation for such systems, with implications not only for Alzheimer's disease research but potentially for the study of tauopathies more broadly. The convergence of artificial intelligence and digital pathology promises to accelerate our understanding of neurodegenerative disease mechanisms and, ultimately, to improve diagnostic precision and therapeutic development.Thank you for reading
