



**Building an End-to-End Data Science Portfolio Project: From Business Problem to Recommendation**
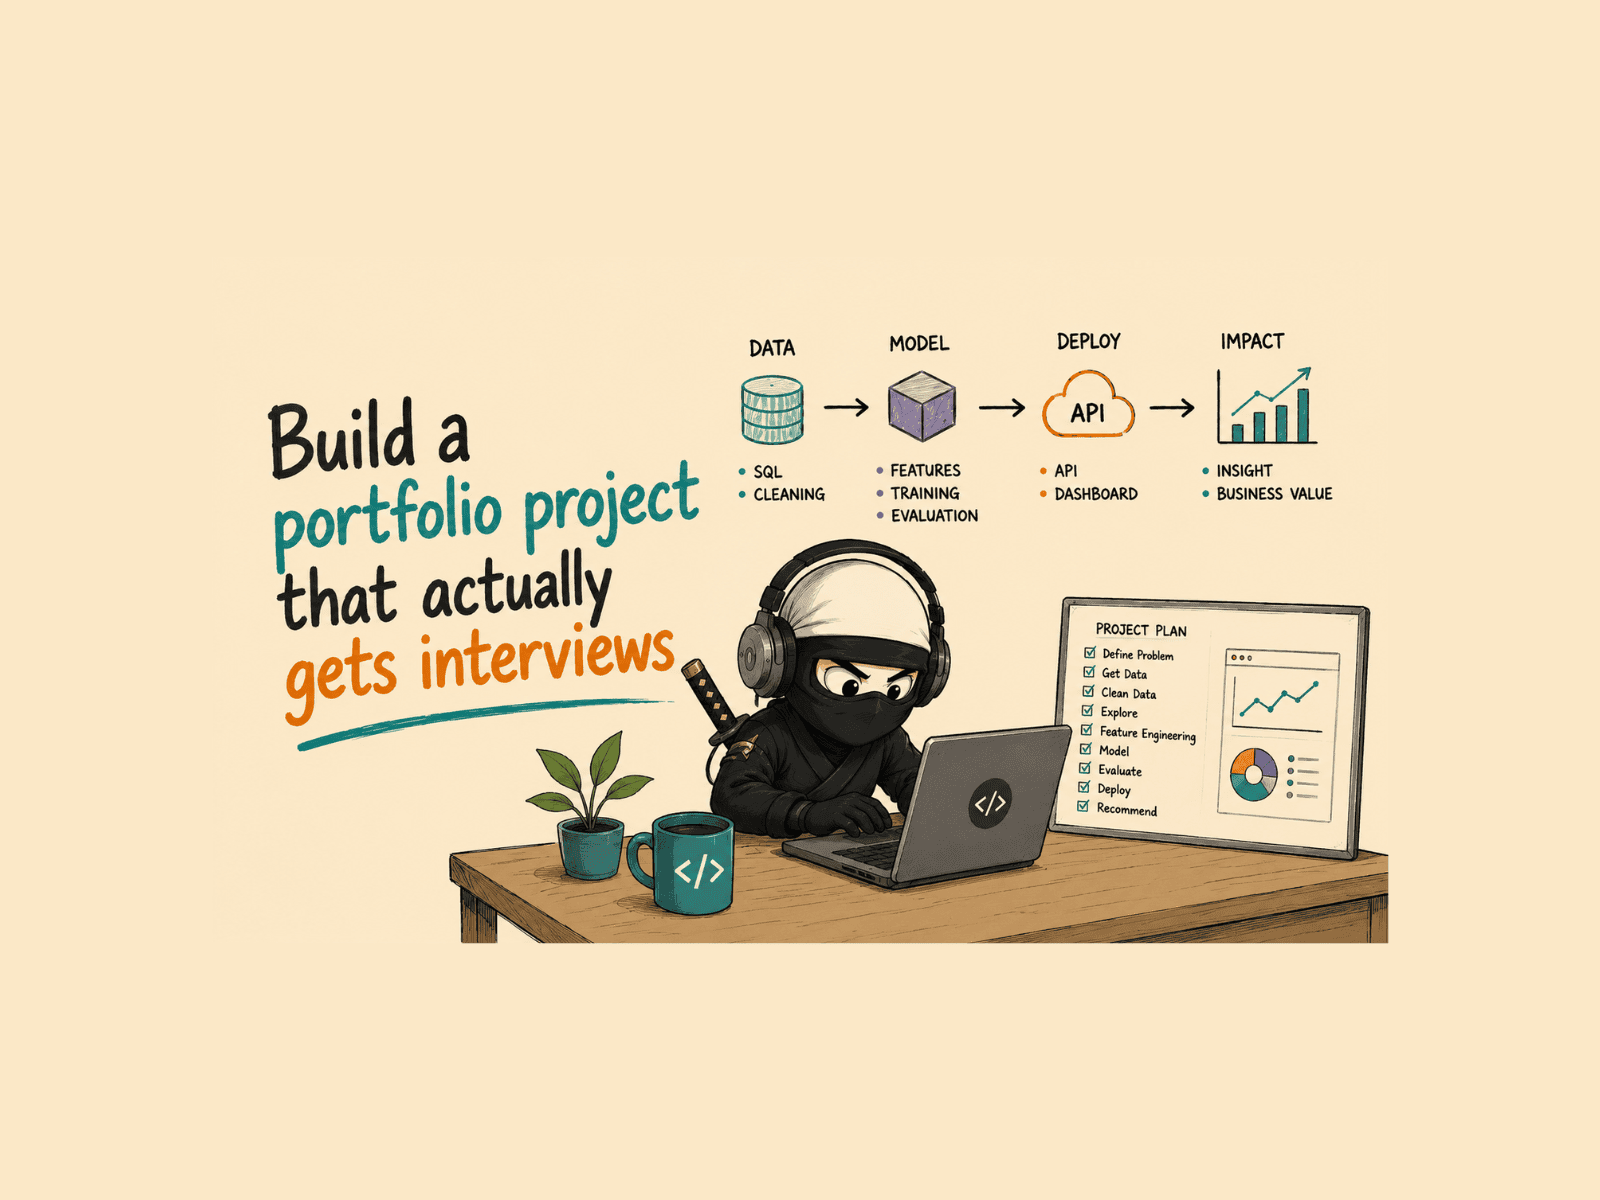
In the competitive world of data science, showcasing your skills through portfolio projects is essential. However, not all projects are created equal. The projects that stand out and lead to job offers are those that follow a complete lifecycle, mirroring real-world data science workflows. This article walks through a full end-to-end data science project using the DoorDash Delivery Duration Prediction dataset, illustrating each stage from framing the business problem to deploying the model and building a dashboard. By the end, you’ll have a blueprint for building your own portfolio projects that demonstrate both technical and business acumen.
### Starting With a Business Problem
Every data science project should begin with a clear business problem. For the DoorDash project, the question is straightforward: given an order, how long will the delivery take? This operational efficiency question directly impacts customer satisfaction and restaurant operations. Framing the project around this question sets the stage for meaningful analysis and ensures that the work remains relevant to business needs. Avoid starting with algorithms; start with outcomes.
### Extracting the Data with SQL
In the real world, data resides in databases, not local files. Using SQL, we query the necessary tables—orders, dashers, and stores—to extract a clean, analysis-ready dataset. This step simulates actual data engineering work and demonstrates your ability to handle real-world data extraction and transformation. The SQL query filters out invalid records and ensures that only relevant data moves forward into analysis.
### Cleaning the Data in Python
Data cleaning is often the most time-consuming part of a data science project. Here, we compute the actual delivery duration by subtracting the order creation timestamp from the delivery timestamp. We also handle missing values, correct data types, and filter out implausible delivery times. Using pandas (and optionally Polars for larger datasets), we ensure the data is reliable and ready for modeling.
### Exploring the Data
Exploratory Data Analysis (EDA) uncovers patterns and insights that inform modeling decisions. We examine delivery duration distributions, analyze variations across markets and times of day, and visualize key trends. These insights not only guide feature engineering but also help tell the story behind the data, a critical skill for communicating results to stakeholders.
### Engineering the Features
Feature engineering transforms raw data into predictive power. We create features such as the ratio of busy dashers to total dashers and an estimate of non-prep duration combining driving and order placement times. Categorical variables are encoded, and redundant features are removed using correlation analysis and Variance Inflation Factor (VIF). The result is a robust set of model-ready features.
### Building the Model
We start with a simple baseline—predicting the mean delivery duration—and then progress to more sophisticated models like Ridge regression and XGBoost. Each model is evaluated using Root Mean Squared Error (RMSE), and cross-validation ensures that performance is robust and not due to luck. Tree-based models, particularly XGBoost, typically perform best on this type of tabular data.
### Evaluating Honestly
Honest evaluation is key to credibility. Using cross-validation, we assess model performance across multiple folds to avoid overfitting. Metrics like RMSE are compared against baselines, and we resist the temptation to tune models on the test set. For classification tasks, metrics like precision, recall, and F1-score should also be considered alongside accuracy.
### Deploying the Model
A model hidden in a notebook has limited impact. We deploy the trained model as an API using FastAPI and joblib, allowing anyone to send order data and receive a delivery prediction. Containerizing the application with Docker enables easy deployment to cloud platforms, making the model accessible to users and stakeholders.
### Building a Dashboard
To make the model user-friendly, we build a dashboard with Streamlit. Users can input order parameters and instantly see predicted delivery times. The dashboard also allows exploration of how different features influence delivery duration. This step ensures that the value of the model reaches non-technical stakeholders.
### Conclusion
The true measure of a data science portfolio isn’t just a well-tuned model—it’s the complete journey from business problem to actionable recommendation. By following all nine stages, you demonstrate end-to-end competence, bridging the gap between technical execution and business impact. Projects like the DoorDash delivery prediction not only showcase your technical skills but also your ability to think critically, communicate clearly, and deliver value. Whether you’re aiming for your first data science role or advancing your career, a strong end-to-end project can make all the difference.
**FAQ**
**What tools and libraries are used in this project?**
The project uses pandas (or Polars), scikit-learn, XGBoost, FastAPI, joblib, Streamlit, Matplotlib, Seaborn, and Docker. SQL is used for data extraction, and the project can be containerized with Docker for deployment.
**Why is business framing important in data science projects?**
Framing the problem around business outcomes ensures that the analysis remains relevant and impactful. It helps prioritize the right questions and deliver recommendations that drive decision-making, rather than just building models for their own sake.
**How does feature engineering improve model performance?**
Feature engineering creates meaningful predictors from raw data, capturing domain-specific insights that models can learn from. Well-engineered features often have a greater impact on model performance than algorithm selection alone.
**What validation techniques are used to ensure model reliability?**
Cross-validation is used to assess model performance across different data splits, providing a more reliable estimate of generalization error. Models are also compared against a baseline to ensure they add value.
**How can someone practice end-to-end data science projects?**
Platforms like StrataScratch offer real company take-home projects from top firms like Meta, Google, and Capital One. Practicing full lifecycle projects and documenting them thoroughly is one of the best ways to build a strong portfolio.
**Is it necessary to deploy models and build dashboards?**
Yes. Deployment and dashboards demonstrate that your work has real-world applicability. They show hiring managers that you can not only build models but also make them accessible and actionable for stakeholders.
**What makes a data science portfolio project stand out?**
A project that tells a complete story—from business framing through deployment—with clear documentation, honest evaluation, and actionable recommendations stands out. Including challenges and what you learned also shows depth of understanding.
—
**Conclusion**
Building an end-to-end data science portfolio project is a powerful way to demonstrate your capabilities to potential employers. By following the full lifecycle from problem framing to deployment and recommendation, you show that you can handle real-world data science challenges. The DoorDash delivery prediction project serves as an excellent template that you can adapt to other domains. Remember, the goal is not just to build models, but to solve business problems. One well-executed project that tells this complete story can do more for your career than multiple incomplete ones. Start with the business question, end with a clear recommendation, and let your work speak for itself.
