



Dell stock sits at $317.05 following a 138% surge fueled by Trump’s May 8 endorsement and a blowout Q1 FY27 earnings report.
Yet clues from the chart and options data indicate the stock may be due for a breather before attempting its next advance.
Dell Q1 FY27 Earnings Smash All Projections
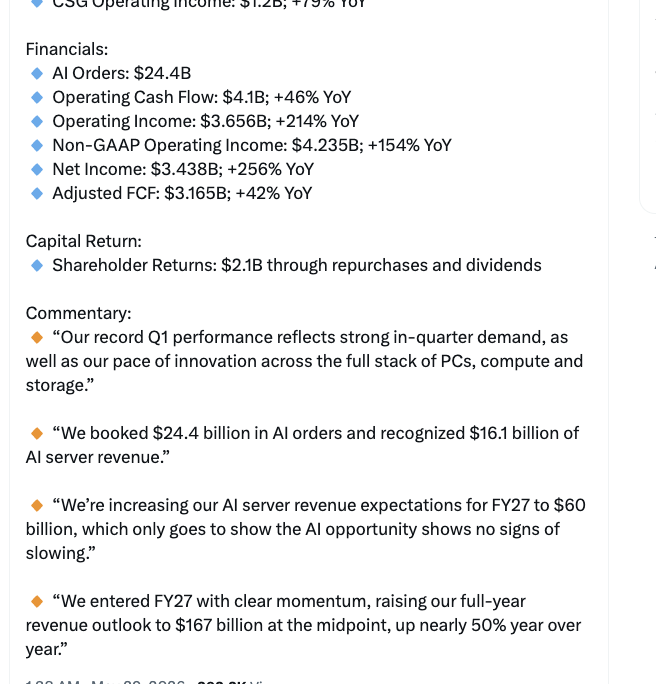
Dell Technologies (NYSE: DELL) posted Q1 FY27 revenue of $43.8 billion, significantly surpassing the $34.81 billion consensus forecast. Adjusted earnings per share (EPS) — which reflects how much profit the company earns for each outstanding share — arrived at $4.86 versus the $2.88 estimate, marking a 214% surge compared to last year.
Looking for analysis like this? Join Editor Harsh Notariya’s Daily Newsletter here.
The AI server division drove the results. Revenue from AI-Optimized Servers hit $16.1 billion, a staggering 757% increase year over year. Dell also accumulated $24.4 billion in AI orders throughout the quarter.
Management upgraded the FY27 AI server revenue outlook to $60 billion, up from $50 billion. Full-year revenue guidance was raised to $165–$169 billion, comfortably ahead of the $143.9 billion analyst consensus.
The sheer magnitude of the beat makes options positioning and institutional money flow on the chart the next logical area to examine. A surprise this large can temporarily overextend a stock, and what follows appears to bear that out.
Trump Endorsement and Pentagon Deal Spark the 138% Surge
The earnings blowout represents the third chapter in a narrative that originated beyond the company. On May 8, 2026, President Trump publicly encouraged investors to “go out and buy a Dell.” The remark arrived mid-rally, while Dell shares were already rebounding off their early-year lows.
Under three weeks afterward, on May 27, Dell secured a $9.7 billion contract with the US Pentagon. That deal gave a concrete fundamental foundation to what had begun as politically driven momentum.
By Thursday, Dell shares had climbed 138% from their early-March base. The sequence reads like a textbook bullish catalyst chain. Yet the internal market indicators surfacing on the same chart hint the move may have gotten ahead of itself.
CMF Double Top and Weakening Volume Point to a Pullback
Dell’s chart started showing internal cracks even as the price pushed to new highs. Chaikin Money Flow (CMF) tracks institutional money flowing in and out of a stock using a blend of price and volume data.
The CMF reading peaked at 0.40 earlier in May before sliding to 0.24. That decline carved out a double-top pattern on the indicator itself, despite the stock continuing to rise.

The CMF remains in positive territory but is now testing an ascending trend line that has underpinned the rally since mid-April. A decisive break below that line would signal institutional money is pulling back.
Volume paints a similar picture. The May 28 earnings session generated a robust 26.61 million shares traded. However, the overall volume trend during the rally has been declining compared to the early March breakout.
When price rises on fading volume, a near-term correction often follows. The doji candle that capped off Thursday’s session strengthens that case. A doji forms when opening and closing prices end nearly identical, reflecting indecision after a powerful move.

If institutional money is retreating while the chart exhibits indecision, the options market provides the next layer of evidence.
Put-Call Volume Ratio Surges Ahead of Q1 Earnings
The options market shifted meaningfully in the run-up to the Q1 report. The put-call volume ratio measures daily put purchases against daily call purchases. A ratio below 1 means more calls are trading than puts, which is typically viewed as bullish.
On May 20, Dell’s put-call volume ratio stood at 0.34 — a strongly bullish reading. Meanwhile, the open interest ratio on the same date was 1.28. Open interest measures total contracts still outstanding, so the 1.28 figure indicated that existing puts already outnumbered existing calls.

By May 28 — earnings day — the volume ratio had climbed to 0.80. The open interest ratio edged up to 1.29. The volume ratio more than doubled over just eight days, even as the stock continued higher.

Heavy put buying on a strong earnings day usually signals hedging activity rather than outright bearish bets. Large shareholders purchase protective puts while maintaining their equity positions. The message is
This direction matches the market value and trading volume picture from the chart.
Wall Street analysts responded to the earnings announcement. Mizuho Securities kept its BUY recommendation and lifted its price target. Truist Financial maintained its HOLD position.

Momentum-driving headlines, declining institutional money flow, and growing put option hedging now coexist. The price chart is the remaining piece of the puzzle.
Dell Stock Price Prediction and Key Levels Post-Earnings
The setup after earnings gives Dell stock a well-defined path visible on the chart. The current price stands at $317 following a higher close yesterday, with the session peak topping $326. The $326 rejection zone lines up precisely with the technical levels from the prior completed swing, confirming the reliability of the existing formation.
The 0.618 Fibonacci retracement of the most recent swing rests at $305, making it a critical support zone. Should the anticipated decline extend further, the $290 area represents the next support cluster below. A correction would push Dell stock price into a descending channel, signaling a bullish flag-and-pole formation. The pole represents the 138% surge since early March.
A retreat to $275, the 0.382 Fibonacci retracement, would still preserve the bullish flag structure. The pattern begins to lose strength below $256. A daily close under $227 would break the setup entirely.

On the bullish side, a successful bounce off $305 or $290 paves the way for an upward continuation. The formation projects toward $431, the 1.618 Fibonacci extension. That target sits close to Mizuho Securities’ revised $435 price target, which was raised from $350 on May 28.
The next move hinges on whether buyers hold the $305 level convincingly. A rebound from $305 separates a leg toward $431 from a deeper correction down to $275 and $256.
The post Dell Stock Up 138% on AI and Trump Push, But Pullback Risk Builds appeared first on BeInCrypto.
