


When organizations move their virtual machine workloads from legacy hypervisors to KubeVirt, they frequently find that most Kubernetes monitoring and observability tools were built with containers in mind—not the unique performance metrics that matter for VMs. Although KubeVirt runs VMs inside pods, the underlying performance dynamics are quite different. Factors like Kubernetes scheduler delays, CSI storage provisioning speeds, and software-defined networking overhead all interact in complex ways that standard kubectl metrics and pod-level monitoring simply cannot capture.
Platform engineering teams require clear, repeatable answers to questions that typical container benchmarks never address:
- Time-to-Ready: The total elapsed time from the initial API request to the moment the guest operating system is reachable over the network—not merely when the pod enters the
Runningstate. - Burst Capacity: How the control plane and storage layer respond when many VMs are created simultaneously (a “boot storm” scenario).
- Live Migration Stun Time: The exact duration of network interruption experienced by a VM during a live migration across the cluster’s overlay network.
To address these measurement challenges, we created the KubeVirt Performance Benchmarking Toolkit, called virtbench. It is an open-source command-line tool designed to run repeatable stress tests on any KubeVirt-enabled cluster—including KubeVirt on OpenShift and other platforms that use CSI-compatible storage.
Why standard benchmarks fall short for VM workloads
Conventional Kubernetes monitoring tools can report everything as healthy even when VM workloads are actually underperforming. Three key architectural differences explain this gap:
Pod readiness is not the same as VM readiness. Kubernetes marks a pod as Ready the instant its container process starts—often within milliseconds. However, a KubeVirt virtual machine instance (VMI) is not truly ready for use until the guest kernel has fully booted, all user-space services have initialized, and the guest agent sends its first heartbeat. Benchmarks that stop timing at pod/Running can underestimate the real time-to-ready by several minutes in typical environments. virtbench solves this by deploying an in-cluster ssh-test-pod that continuously probes the VMI’s network stack; the measurement only ends once an SSH connection is successfully established.
CSI provisioner strain with multi-disk VMs. In production, a single VM often needs multiple persistent volume claims—one for the boot disk, another for swap, and one or more high-performance data volumes. Container-oriented benchmarks do not test whether a CSI driver can simultaneously provision and attach several block devices to the same VMI. virtbench replicates these real-world configurations, stressing the entire DataVolume → PVC → block device pipeline under concurrent load.
Overlay-network live migration versus vMotion. VMware vMotion transfers a running VM’s memory state over a dedicated, high-bandwidth TCP connection. KubeVirt live migration, by contrast, routes the same memory transfer through the cluster’s software-defined network overlay (such as OVN-Kubernetes), which introduces additional latency and competes with regular workload traffic. virtbench precisely measures the stun time—the period during which the VM’s network interface is unreachable—for both sequential and parallel migration scenarios.
How virtbench measures VM readiness
virtbench follows a client-side orchestration approach with the help of an in-cluster helper pod. The measurement workflow proceeds as follows:
- API Trigger:
virtbenchsendsVirtualMachineresource definitions to the Kubernetes API server, which in turn creates the correspondingDataVolumeandPVCobjects through the CSI driver. - State Machine Tracking: The CLI continuously polls the VMI’s status, following the complete lifecycle transition:
Pending → Scheduled → Bound → Running. - Guest Network Probing: A dedicated
ssh-test-podrunning inside the cluster sends repeated TCP connection attempts to each VMI’s assigned IP address. - Measurement Completion: The stopwatch stops only after a successful TCP handshake, confirming that the guest network stack is fully functional.
All results are exported in structured JSON and CSV formats and then visualized in an interactive HTML dashboard for easy analysis. The tool runs four internal benchmark engines—DataSource Clone, Migration, Capacity, and Failure Recovery—each built as a separate module that interfaces with the KubeVirt and storage APIs.
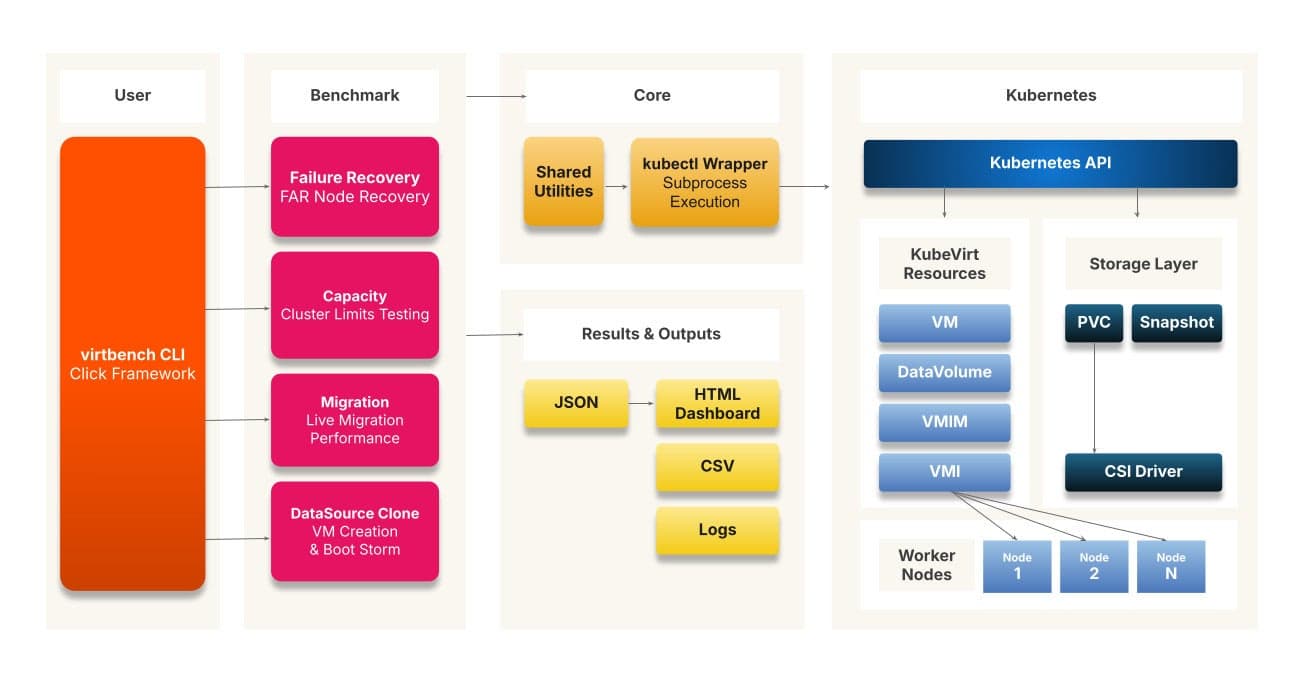
Figure 1: virtbench Architecture
Benchmark scenarios included in virtbench
virtbench comes with six pre-built test scenarios:
| Scenario | What It Tests |
|---|---|
| DataSource VM Provisioning | Storage cloning efficiency and volume creation times |
| Single Node Boot Storm | Node-level capacity under simultaneous VM power-on |
| Multi-Node Boot Storm | Cluster-wide startup performance; simulates post-outage recovery |
| Live Migration | VM migration stun time; supports sequential and parallel runs |
| Chaos Benchmark | Concurrent chaos operations (create, resize, clone, restart, snapshot) |
| Failure and Recovery | HA validation via Fence Agents Remediation; measures time-to-recovery |
Visualizing performance bottlenecks
Insights are automatically populated into a comprehensive, multi-chart HTML dashboard for immediate analysis.
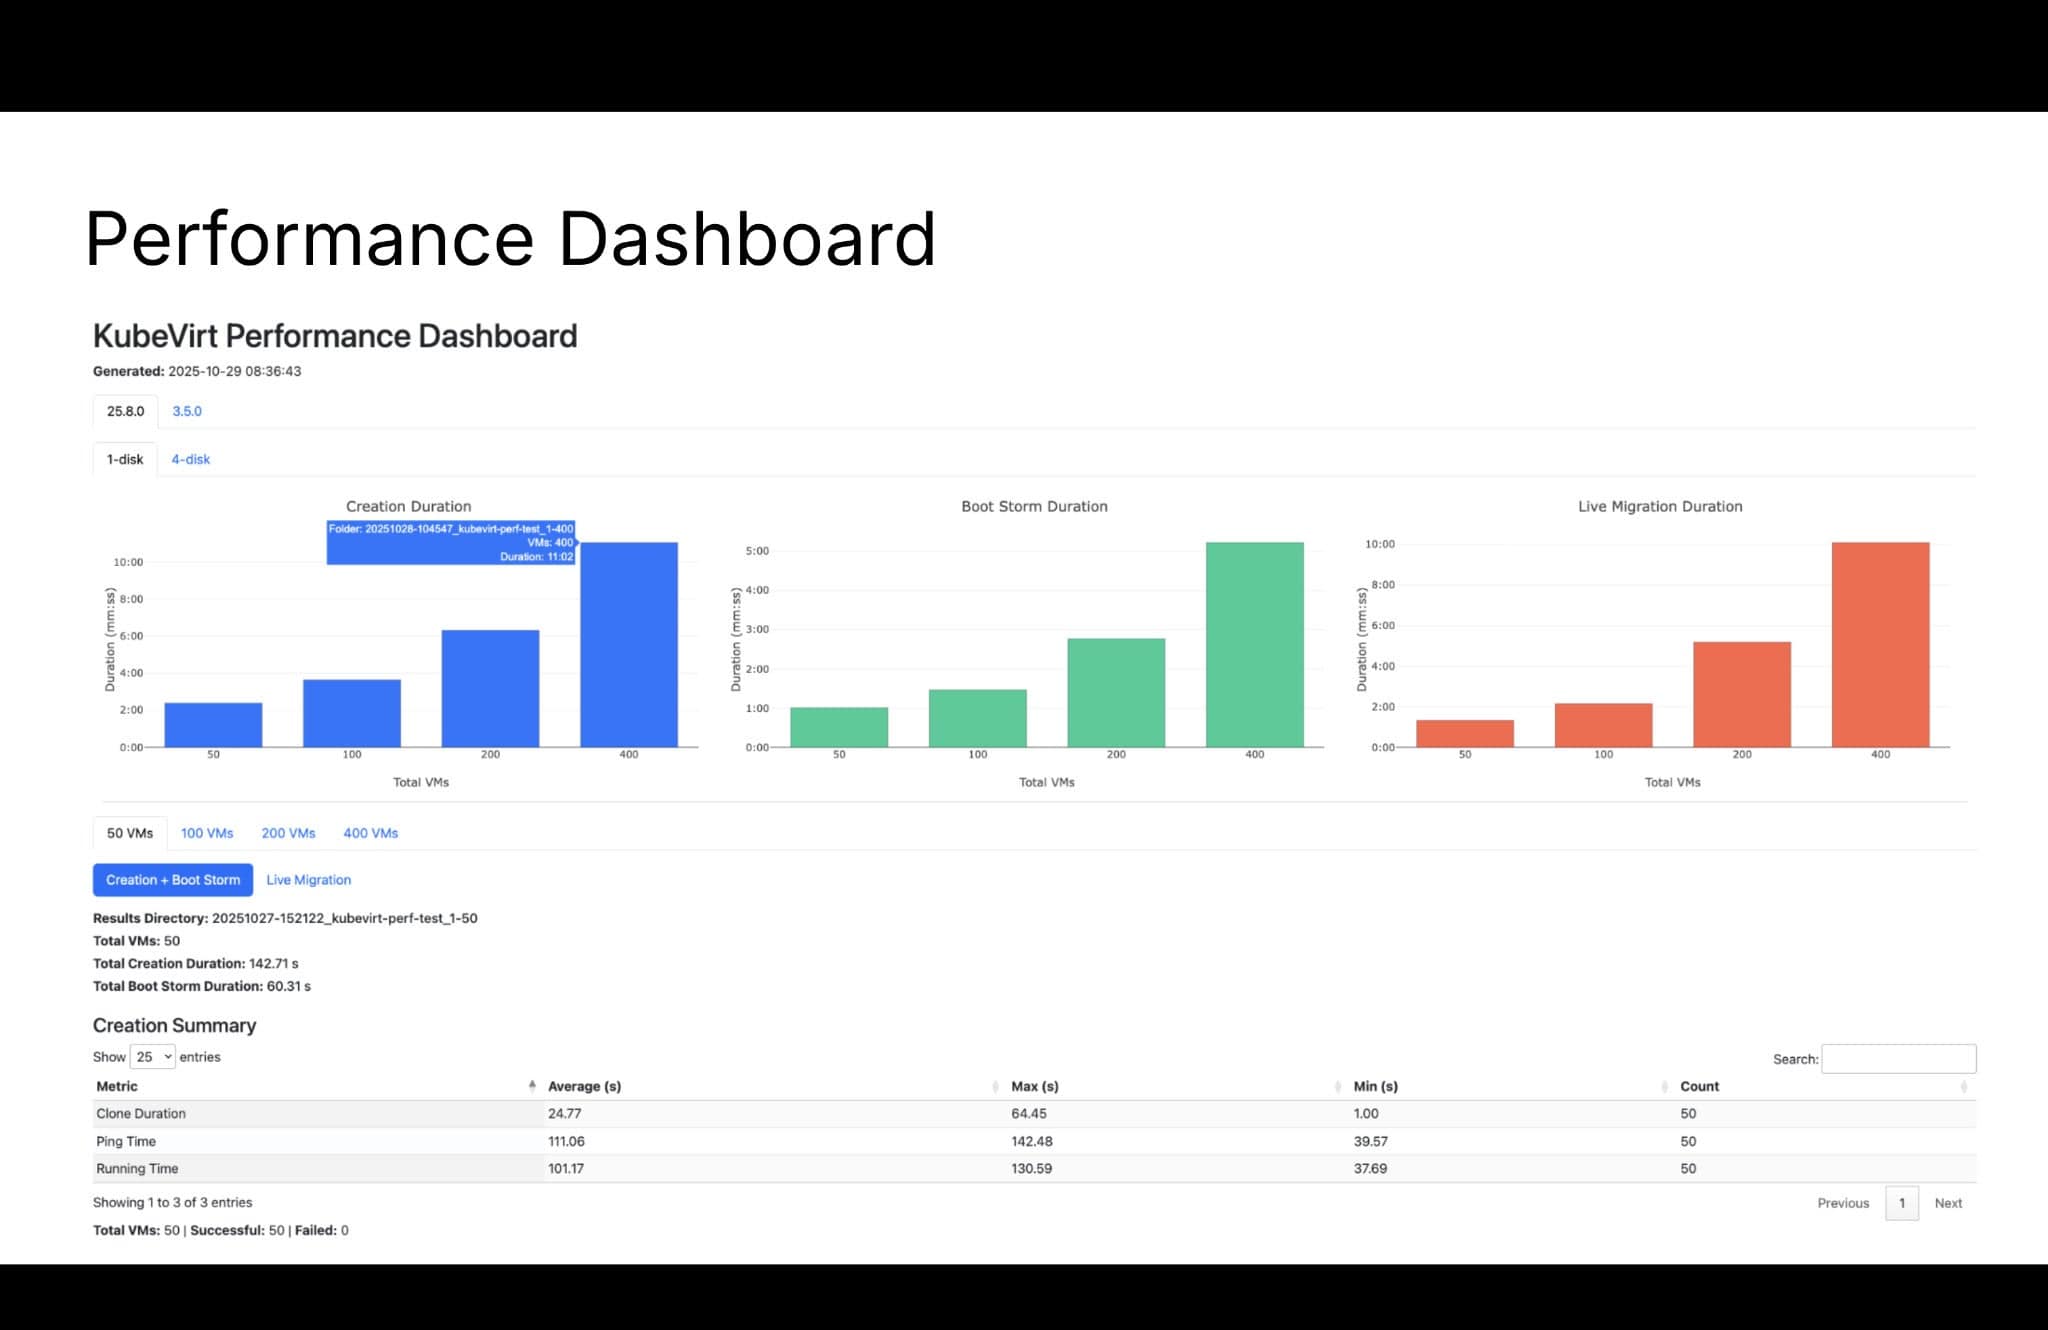
Figure 2: Performance Dashboard
Each graph captures a specific measurement stage:
- Creation Duration (blue): The time it takes to provision a single VM under sequential load—this establishes your baseline for storage provisioning and scheduler performance.
- Boot Storm (green): Provisioning latency when multiple VMs are launched simultaneously (N-concurrent requests)—this reveals saturation thresholds in the CSI driver or etcd write throughput.
- Live Migration (orange): Migration time and stun duration for each VMI during node evacuation—this helps define your maintenance window SLAs.
A Creation Summary table breaks down end-to-end provisioning time into three distinct sub-phases: clone_duration (CSI copy time), running_time (kubelet container start), and ping_time (guest network probe). This granular view pinpoints whether a performance regression is rooted in the storage tier, the container runtime, or the guest operating system initialization sequence.
Alternative benchmarking tools compared
| Tool | Objective | Where virtbench fits |
|---|---|---|
| kube-burner | API/control plane overhead (etcd, scheduler) | Measures the data path: clone speeds, OS boot times, network reachability |
| fio / iperf wrappers | Standalone disk/network micro-benchmarks | Evaluates component behavior under load (e.g., network throughput while live migration is underway; clone speed during a boot storm) |
| KubeVirt E2E tests | Binary pass/fail | Quantitative: “How long did the operation take?” Surfaces performance issues before they reach production |
Use Case: An upcoming release will introduce in-VM fio tooling to perform I/O benchmarking directly from inside the guest OS.
Executing your first virtbench benchmark
virtbench integrates directly into staging CI pipelines. This allows you to run benchmarks both before and after infrastructure changes—such as storage platform upgrades, CNI migrations, or Kubernetes version updates—to catch performance regressions before they affect production environments.
Since benchmark results are typically highly dependent on the specific environment, sharing methodologies and reproducible testing practices is particularly beneficial for the KubeVirt community.
Contributing & Future roadmap
The project is open source and welcomes community feedback and contributions: github.com/portworx/kubevirt-benchmark.
Performance characteristics vary significantly across storage backends, CNI implementations, and hardware configurations, making community submissions and benchmark data extremely valuable. The project welcomes reproducible test scenarios, cross-platform comparisons, and additional benchmark modules from operators running KubeVirt in production.