



# How AI-Powered Vision Systems Are Transforming Spot Weld Inspection in Automotive Manufacturing
## The Challenge of Quality Control at Scale
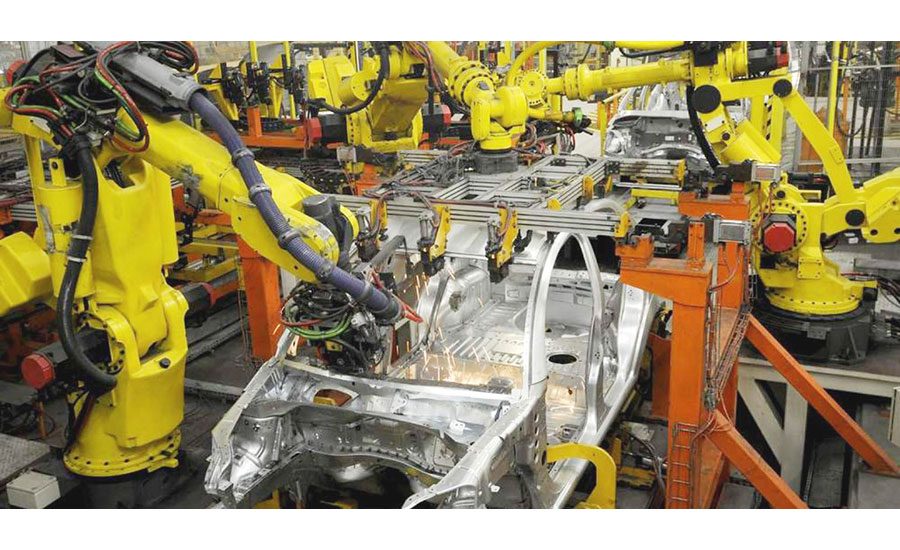
Modern automobile manufacturing relies on robotic spot welding to join thousands of individual metal sheets into a vehicle’s body structure. On a fully automated assembly line, a single car body can contain several thousand of these welds, all executed by robotic arms working at high speed. Once the welding is complete, however, a critical question remains: how can manufacturers verify that every single weld meets quality standards?
Traditional inspection methods are often too slow or too inconsistent to keep pace with high-volume production. Manual visual checks introduce human error, and destructive testing — while accurate — is impractical when applied to every weld point on every vehicle. This gap between production speed and quality assurance has long been one of the biggest pain points in automotive manufacturing.
A team of researchers set out to tackle this problem head-on by designing a system that combines machine vision, deep learning, and predictive analytics to inspect spot welds automatically, classify them as either acceptable or defective, and even forecast when a welding robot will need servicing.
—
## How the Inspection System Works
### Camera Setup and Image Acquisition
The inspection station is positioned along the body-in-white production line, immediately after the cabin section has been assembled. On each side of the cabin, two monochrome cameras are mounted at a fixed distance of 1.3 meters from the workpiece. One camera is angled to capture the upper portion of the cabin structure, while the other focuses on the lower section. Supplemental lighting is used to ensure consistent image brightness and contrast across all shooting conditions.
Each camera captures images at a resolution of 12 megapixels, producing photographs that measure 4,096 pixels wide by 3,000 pixels tall. Over the course of three consecutive days of uninterrupted production, the system accumulated a total of 8,092 images drawn from 674 different cabin assemblies. From these raw images, the system was able to isolate and extract data on 63,073 individual spot welds.
### From Wide-Angle Images to Individual Weld Analysis
Photographing each spot weld separately would yield extremely detailed results, but the process would be far too time-consuming for a real-world production environment. Instead, the system captures wide-angle images containing many welds simultaneously. A deep-learning model then scans each image, detects the location of every weld point, and crops each one into a standardized 30-by-30 pixel image for further analysis.
This approach strikes a balance between speed and precision, allowing the system to process entire cabin assemblies in a fraction of a second.
### Extracting Key Weld Parameters
Not all visual information in a spot weld image is equally relevant to quality assessment. The researchers trained their system to identify and measure two specific physical characteristics that research has consistently linked to weld strength:
– **Nugget diameter** — the size of the region where the overlapping metal sheets have been fused together internally through heat and pressure.
– **Heat-affected zone (HAZ) size** — the surrounding area of the sheet material that has been altered by thermal exposure without actually melting.
The system estimates the boundaries of both regions by detecting their centroids and fitting enclosing polygons around them. The diameter is calculated as the shortest side of each polygon, and results are expressed in pixel units before being converted to millimeters.
Under ideal conditions, a properly formed weld exhibits smooth inner and outer elliptical contours, a clearly defined fusion zone at the center, and a diameter falling between 2 and 3 millimeters. The fusion zone lies within the inner ellipse, while the HAZ extends to the outer ellipse boundary.
### Common Defect Types
When welding parameters are not correctly calibrated, or when there is inconsistent contact between the sheets being joined, several types of visual defects can appear:
– **Cold spots** — areas where insufficient current or heat resulted in incomplete fusion.
– **Excessive metal expulsion** — caused by overly high electrode current, leading to deformed or ejected material around the weld perimeter.
– **Burrs in the fusion zone** — small protrusions of material forced out during the welding process.
– **Pitting** — surface irregularities caused by prolonged electrode pressure duration.
The system assigns each weld a label of either “good” or “bad” based on the visible surface characteristics and the presence or absence of these defects. It is important to note that this classification is based entirely on visual inspection and does not constitute a mechanical strength test, since no destructive testing was performed as part of this study.
—
## Training the AI Models
### Feature Extraction and Dimensionality Reduction
The system extracts several numerical descriptors from each weld image to characterize its visual properties. Mean intensity and energy values capture the overall brightness of the weld region, which correlates with thermal input and surface appearance. Standard deviation measures how much the pixel intensities vary across the region, which can reveal uneven heat distribution. Skewness and kurtosis provide information about the asymmetry and concentration of intensity values, which may reflect irregularities in weld formation or changes in the HAZ.
Because these descriptors can be highly correlated with one another, the researchers applied linear discriminant analysis (LDA) to reduce the data to a two-dimensional representation. This simplified the input for the subsequent classification model while preserving the most important distinguishing features between good and bad welds.
### Neural Network Architecture and Validation
The classification model was built using a feedforward neural network with one input neuron, fifteen neurons in a single hidden layer, and two output neurons (one for each class). To ensure the model’s reliability, the team used five-fold cross-validation, rotating the data through training and testing cycles five times.
For the nugget and HAZ measurement models specifically, the researchers used 100 training images and 30 validation images, with boundaries manually labeled by experts. These models achieved average diameter estimation errors of 5 percent for the nugget and 3 percent for the HAZ.
For the broader quality classification task, the dataset was balanced to 1,000 images per class — 800 for training and 200 for validation. The team found that increasing the dataset beyond this size did not yield meaningful improvements in performance, indicating that the model had effectively learned the relevant distinguishing features.
—
## Predictive Maintenance Using Convolutional Neural Networks
### Defining Maintenance Categories
One of the most innovative aspects of this system is its ability to predict when a welding robot will need attention. The approach is grounded in the principle that defect rates that follow an upward trend over time often signal equipment wear or degradation.
The framework draws on quality standards that define acceptable failure thresholds for vehicle chassis systems. When defect rates remain low, no action is needed. As rates climb, different levels of intervention become appropriate. The researchers defined four distinct maintenance categories based on cumulative defect rates:
| Maintenance Level | Defect Rate Threshold |
|—|—|
| No Maintenance | Below 0.1% |
| Preventive Maintenance | 0.2% – 0.4% |
| Predictive Maintenance | 0.6% – 0.9% |
| Corrective Maintenance | 1.0% or higher |
These categories were derived from established quality criteria and mapped to historical defect data to train the prediction model.
### How the Prediction Model Works
The convolutional neural network (CNN) receives as input a cumulative summary of welding data collected over 30 production hours, broken into one-hour time windows. For each time window, the model considers the number of good and bad welds, the average nugget diameter, and the average HAZ diameter. This data is averaged for each specific weld point across multiple robots and production days.
The model is designed to be robust to real-world variations in the production environment. It naturally accounts for fluctuations in lighting conditions, minor camera vibrations, changes in the reflective properties of the weld surface, and slight differences in how the cabin is positioned on the line.
The CNN analyzes trends over a rolling three-day window, enabling it to detect gradual shifts in weld quality that may indicate an impending equipment issue — long before the defect rate reaches a critical threshold.
—
## Results and Performance Metrics
### Defect Classification
The quality classification model achieved the following performance metrics on the validation dataset:
– **Accuracy:** 95.8%
– **Precision:** 95.6%
– **Recall:** 96.0%
– **F1-Score:** 95.8%
Each cabin assembly was classified in approximately 0.5 seconds, making the system fast enough for real-time integration into a production line.
### Maintenance Prognosis
The maintenance prediction model was evaluated across all 63,073 spot welds in the database. Its performance was as follows:
– **Accuracy:** 95.87%
– **Precision:** 94.72%
– **Recall:** 94.42%
– **F1-Score:** 93.97%
Average processing time for the maintenance prognosis was also 0.5 seconds, confirming that the system is suitable for continuous online monitoring in a live manufacturing environment.
—
## FAQ
### What types of defects can the system detect?
The system is trained to identify visual surface defects including cold spots (incomplete fusion), excessive metal expulsion, burrs in the fusion zone, and pitting caused by prolonged electrode pressure. It classifies each weld as either acceptable or defective based on these visible characteristics.
### How does the system handle variations in lighting and camera positioning?
The convolutional neural network is trained on data collected from multiple robots across different days under varying operating conditions. This diverse training set naturally exposes the model to changes in illumination, minor camera vibrations, and slight variations in workpiece positioning, making it robust to these real-world factors.
### Does this system replace the need for mechanical testing?
No. The visual classification system provides a fast and non-destructive method for screening welds, but it does not measure actual mechanical strength. Destructive testing of representative samples from each quality category is still recommended to validate that visual classification correlates with structural integrity.
### Can the system be adapted for other types of welding?
The general framework — using machine vision to detect features, a deep-learning model to classify quality, and a CNN for trend analysis — could potentially be adapted to other welding processes. However, the specific features, parameters, and training data would need to be tailored to the particular welding method and joint geometry being inspected.
### What are the key advantages of using AI for spot weld inspection?
The primary advantages are speed, consistency, and predictability. The system can classify thousands of welds in seconds, eliminates human subjectivity, and can identify deteriorating trends in weld quality before they result in unacceptable failure rates. This allows manufacturers to shift from reactive maintenance to proactive and predictive maintenance strategies.
### Is the system already deployed in production environments?
The results described here are based on a research study using historical production data. Further validation and testing would be required before a similar system could be deployed in a live manufacturing setting.
—
## Conclusion
The integration of machine vision and artificial intelligence into spot weld inspection represents a significant step forward for automotive manufacturing quality control. By combining real-time defect detection, automated quality classification, and predictive maintenance forecasting, this approach addresses multiple challenges simultaneously — from identifying individual weak welds to anticipating equipment degradation before it impacts production.
The system’s ability to process an entire cabin assembly in approximately half a second makes it practical for deployment on high-speed assembly lines. Its use of convolutional neural networks enables it to handle the natural variability of a manufacturing environment without requiring manual recalibration for every shift or production run.
Of course, the system has limitations that warrant further investigation. The current model classifies welds into only two categories, and future work could expand this to identify specific defect types. Additionally, while the visual classifications are highly accurate, they have not yet been cross-validated against destructive mechanical testing. Confirming that visual quality correlates directly with structural strength would significantly strengthen confidence in the system’s recommendations.
Despite these limitations, the research demonstrates a compelling proof of concept: AI-powered vision systems can serve as a reliable, fast, and proactive quality assurance tool in automated welding environments. As deep learning models continue to improve and camera technology advances, such systems are likely to become a standard feature of smart manufacturing lines across the automotive industry and beyond.
Thank you for reading
