



# NucleicBERT: Advancing RNA Understanding Through Transformer-Based Deep Learning
## Introduction
RNA molecules play critical roles in cellular processes ranging from gene regulation to protein synthesis, yet predicting their structural and functional properties remains a formidable challenge in computational biology. To address this gap, researchers have developed a large-scale language model specifically designed for nucleic acid sequences. This model leverages the power of transformer architectures to learn rich representations of RNA, opening new possibilities for downstream biological discovery.
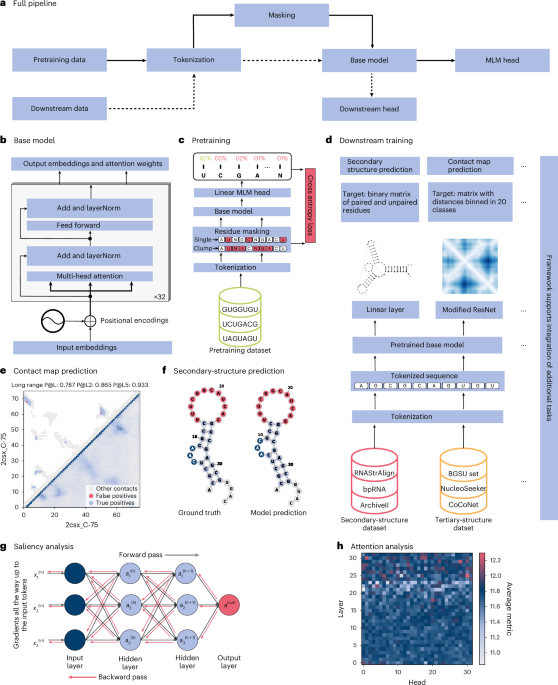
The model comprises 32 transformer layers, each equipped with 32 attention heads and an embedding dimension of 1,024. Learned positional encodings are integrated throughout the architecture to capture position-specific patterns critical for RNA folding and function. With approximately 404 million parameters, this model represents a significant step forward in the application of deep learning to molecular biology.
## Tokenization Strategy and Vocabulary
A distinctive feature of this model lies in its tokenization approach. The team employed byte pair encoding with a clump size of one, effectively creating a character-level tokenization strategy where each nucleotide or ambiguity character becomes its own independent token. This approach preserves maximal granularity without any merge operations, making it particularly well-suited to the relatively small alphabet of RNA sequences.
The resulting vocabulary consists of 25 tokens. This includes the four standard RNA nucleotides (adenine, uracil, guanine, and cytosine), 16 ambiguity characters, and five special tokens. The ambiguity codes extend beyond conventional IUPAC representations, having been empirically determined by identifying all unique non-standard characters present in the training corpus. The special tokens serve distinct purposes: one token is used for padding sequences within batches, another denotes unknown or out-of-vocabulary characters, a masking token facilitates masked language modeling, a classification token is prepended to each sequence to aggregate global context, and a separator token divides input segments when required for downstream applications.
## Pretraining Methodology and Dataset
The model was pretrained using a masking strategy adapted from established language modeling frameworks, combining both token-level and subsequence-level masking approaches. For token-level masking, 15% of tokens in each input sequence were selected at random. Of these, 80% were replaced with the masking token, 10% were substituted with a random token from the vocabulary, and 10% were left unchanged. This dual strategy encourages the model to learn both local patterns and higher-order sequence dependencies.
In parallel, a subsequence masking strategy was employed, where contiguous spans of four to eight tokens were randomly selected and masked as a group. This span-based approach draws inspiration from prior work in protein language modeling and is designed to promote learning of biologically meaningful RNA motifs, which frequently appear as short subsequences.
For training data, non-coding RNA sequences were obtained from a comprehensive database containing approximately 1.7 billion sequences in FASTA format. By filtering for sequences annotated with the non-coding RNA keyword, the researchers extracted roughly 30 million sequences. Of this filtered dataset, 80% was allocated for training and the remaining 20% for validation.
Training utilized 192 high-performance GPUs, employing a linear learning rate schedule with a batch size of 16. To ensure stable gradients and prevent overfitting, a dropout rate of 0.1 was maintained and gradient values were clipped to 0.001. Each epoch of training required approximately one hour and twenty minutes, with the model trained across 300 epochs. Pretraining accuracy eventually plateaued at 83.1% on the validation dataset.
Initial experiments with a smaller 101-million-parameter variant revealed that pretraining accuracy stagnated at 52%, underscoring the importance of model capacity for capturing complex patterns inherent in RNA sequence data.
## Dimensionality Reduction for Embedding Analysis
For analyzing the embeddings generated by the model, the researchers employed the PHATE dimensionality reduction technique. Unlike clustering-focused approaches such as t-distributed stochastic neighbor embedding or principal component analysis, PHATE preserves continuous trajectories and branching structures through a diffusion-based framework. It simulates random walks across data manifolds to capture global relationships, making it particularly effective at revealing biological transitions within high-dimensional embedding spaces.
The PHATE process involves computing local similarities using decaying kernels, creating Markovian transition matrices, and raising these matrices to successive powers to simulate longer diffusion processes. This operation effectively denoises data while preserving global relationships between distant points. Rather than using diffusion coordinates directly, PHATE computes an information-geometric potential distance between probability distributions, providing a powerful tool for visualizing RNA sequence relationships.
## Secondary Structure Prediction
### Architecture and Training Framework
For secondary structure prediction, the researchers developed a binary classification framework that determines whether nucleotide pairs form base-pairing interactions. This approach attaches a bottleneck residual network architecture to the pretrained model, which processes pairwise nucleotide representations generated through outer concatenation of the transformer embeddings. Specifically, the representation for a nucleotide pair at positions i and j is constructed by concatenating the embedding vectors from the model’s final layer.
The prediction network generates a symmetric probability matrix indicating base-pairing likelihood for each nucleotide pair in the sequence. Optimization is performed using a binary cross-entropy loss, with gradients computed exclusively for the upper triangular portion of the matrix to account for base-pairing symmetry constraints. Training proceeds for 50 epochs using a learning rate of 1 × 10⁻⁵, with all model parameters updated simultaneously without gradual unfreezing strategies.
### Decoding and Evaluation
The predicted probability matrix is converted into discrete secondary structures using a greedy decoding algorithm. This iterative process selects the highest-probability nucleotide pair as base-paired, then removes conflicting pairs from consideration in subsequent iterations. The algorithm enforces biological constraints by excluding non-Watson–Crick pairings and preventing formation of hairpin loops shorter than four nucleotides.
To account for structural flexibility in real RNA molecules, the evaluation accepts near-correct predictions as valid. Following established protocols, predictions within one position of the true pairing are scored as accurate. For a reference pair at positions (i, j), predictions at (i ± 1, j) and (i, j ± 1) are considered accurate. Final performance metrics represent the average of individual structure-level calculations across the entire test set.
### Benchmark Datasets
Several benchmark datasets were employed to evaluate secondary structure prediction performance:
1. **The RNAStrAlign dataset** comprises over 37,000 RNA structures from eight distinct RNA families, with sequence lengths ranging from approximately 100 to 3,000 base pairs.
2. **The ArchiveII dataset** consists of nearly 4,000 RNA structures from ten RNA families, with lengths ranging from approximately 100 to 2,000 base pairs. A cutoff of 600 base pairs is applied to match the standard dataset size used in comparable tools.
3. **The bpRNA-1m dataset** contains a large number of highly similar sequences, requiring a sequence identity cutoff of 80%. The dataset is randomly split into training, validation, and test subsets comprising over 10,000, 1,300, and 1,300 structures respectively.
The model was trained on the RNAStrAlign and training subset data combined, then tested on the ArchiveII600 and test set datasets.
## Tertiary Structure Prediction
### Distance and Contact Map Representation
To leverage representations learned during pretraining, the model was fine-tuned to predict distance maps and contact maps for given RNA sequences. Distance maps provide a translationally and rotationally invariant topological representation of an RNA molecule. For a sequence of length L, a distance map is an L × L matrix where the entry at position (i, j) indicates the Euclidean distance between atoms in residues i and j.
Contact maps are a binary representation derived from distance maps, where a threshold distance determines whether two nucleotides are in contact. The researchers used a threshold of 8 angstroms, below which nucleotides are considered to be in contact (represented as 1) and above which they are not (represented as 0). This simplified binary representation captures essential structural information while reducing noise and computational complexity.
### Data Preparation
The PDB database contains merely 8,446 annotated tertiary RNA structures as of early 2025, reflecting the inherent scarcity of such data. The researchers addressed this challenge by using the BGSU RNA 3D representative dataset as their starting point. Sequences were filtered for lengths between 32 and 1,024 nucleotides, and redundancy was removed using CD-HIT-EST with an 80% sequence identity threshold. Structural quality was ensured through rigorous curation.
For each selected structure, the sequence, resolution, and chain information were extracted from mmCIF files. A separate non-redundant dataset was also created using NucleoSeeker for downstream training. Both datasets were used separately and demonstrated similar performance.
To prepare distance maps, distances between heavy atoms of each residue are calculated against every other residue. These distances are assigned to 20 discrete classes according to a specific binning scheme that ranges from very close contacts to distant interactions. Missing residues in PDB structures are addressed using structure repair tools, and non-standard residues are replaced using chemical component dictionaries. Trivial distances originating from the backbone are removed to focus on meaningful long-range interactions.
### Image Segmentation Approach
The downstream supervised model employs image segmentation techniques. Attention weights from the pretrained model are fed into a ResNet architecture, which classifies each element of the attention weights into one of the 20 distance categories.
Contact map prediction presents unique challenges that differentiate it from conventional computer vision tasks. While distance maps can be interpreted as two-dimensional images, making contact prediction superficially analogous to pixel-level image labeling, several important distinctions exist. Contact maps must preserve the native dimensions of the RNA sequence rather than being resized to fixed dimensions. The input features incorporate both sequential and pairwise information, making them substantially more complex than raw pixel intensities. Additionally, the label distribution in contact maps is highly imbalanced, with positive contacts typically comprising less than 2% of all predictions.
## Splice-Site Prediction
### Problem Formulation and Datasets
Splice-site prediction was formulated as a binary classification problem, where the model must distinguish between authentic splice sites and non-functional sequences. Evaluation was conducted using carefully curated multi-species datasets that have become standard benchmarks in the field.
The benchmark datasets encompass four evolutionarily diverse species: zebrafish, fruit fly, nematode worm, and thale cress. Each benchmark contains 10,000 splice-site sequences and 10,000 non-splice-site sequences, maintaining a balanced 1:1 ratio to prevent class imbalance bias. The datasets include both canonical and non-canonical splice sites, with the latter varying in frequency across species.
The original datasets were constructed from high-quality genomic sequences obtained from a major genome database, with splice sites extracted and flanked by 300-nucleotide environments to provide sufficient sequence context. A verification process ensured that no sequences containing undetermined nucleotides were included. Each sequence spans 600 nucleotides total, with the GT (donor) or AG (acceptor) dinucleotide positioned at the central location.
The negative subset construction employed a heterogeneous approach, incorporating three categories of non-splice-site sequences: randomly selected exon regions, randomly selected intron regions, and false-positive sequences containing GT or AG dinucleotides that do not correspond to authentic splice sites. This heterogeneous negative dataset design has been shown to achieve superior performance compared with homogeneous alternatives.
Rigorous quality control procedures classified sequences into confirmed and unconfirmed categories through expert-guided comparative sequence analysis. Only confirmed sequences were retained to ensure biological authenticity, and duplicate sequences were systematically removed to prevent overfitting.
### Fine-Tuning Strategy
For this downstream task, the model was fine-tuned using a two-layer sequence-level classification head that processes contextual embeddings to make binary predictions. The fine-tuning process was performed separately for donor and acceptor splice sites to optimize performance for each specific recognition task.
## Shuffled Sequence Detection
The model’s capacity to identify authentic RNA sequences was assessed by systematically introducing controlled perturbations through nucleotide shuffling. Using the same dataset employed for secondary structure prediction, shuffled variants were generated with perturbation levels ranging from 0% to 100% in 5% increments. At each shuffle percentage, the fraction of sequences the model classified as authentic RNA was measured.
To investigate whether the model preferentially attends to structurally critical regions, targeted perturbation analysis was performed focusing exclusively on Watson–Crick base-paired positions identified from known secondary structures. This approach enabled assessment of the model’s understanding of hierarchical constraints governing RNA folding.
To determine whether observed performance thresholds reflect genuine biological constraints rather than training artifacts, sequence variation patterns were analyzed across natural RNA families. Seed multiple sequence alignments were extracted for over 4,000 RNA families from a comprehensive RNA family database, focusing on families containing at least five sequences. For each family, a representative sequence was identified by optimizing similarity across all family members, and maximum sequence variation tolerance was calculated using normalized edit distance.
## Coevolution Analysis from Single Sequences
The pretrained model was probed for coevolution-like couplings using the Mutual Information-like Index (MLI) score. For an input sequence, MLI quantifies how much the model’s predictive log-probability for the native nucleotide at position i changes when position j is additionally masked.
The raw L × L matrix is symmetrized with a zero diagonal, generalizing the single-mask perplexity approach used in protein language models to a paired-position perturbation framework. This alignment-free method enables coevolution analysis from individual sequences without requiring multiple sequence alignments at the model inference level.
Per-family aggregation is achieved by computing the MLI matrix for every aligned sequence in a post-filtering multiple sequence alignment and averaging across the alignment. Average product correction is then applied to remove the dominant column- and row-conservation contribution to coupling magnitudes, enabling comparison with classical mutual information and direct coupling analysis methods.
## Fitness Prediction
The model was applied to predict RNA sequence fitness using a comprehensive mutagenesis dataset representing a systematic study of RNA substrates for cytoplasmic polyadenylation element-binding protein 3. This dataset contains fitness landscape data from high-throughput cleavage assays where mutagenized RNA sequences were evaluated for susceptibility to cleavage. Each RNA variant was tested across three independent biological replicates, with fitness calculated as the ratio of cleaved to uncleaved RNA molecules.
For fitness prediction, a task-specific regression head was employed, consisting of a three-layer perceptron that maps 1,024-dimensional RNA sequence representations to scalar fitness predictions. An 80:20 train-test split was implemented to ensure evaluation across the full mutational spectrum.
A biologically informed baseline was also developed using a ball-query model, essentially a k-nearest-neighbors approach that measures distance between sequences using the symmetric distance between mutation sets. For each target sequence, all reference sequences within a specified cutoff radius are identified, and the fitness value is computed as the average fitness of sequences within that radius.
## Frequently Asked Questions
**What makes NucleicBERT different from general-purpose language models?**
NucleicBERT is specifically designed for RNA sequences, employing a vocabulary tailored to the RNA alphabet including standard nucleotides, ambiguity characters, and special tokens. Its pretraining on non-coding RNA sequences and its architecture are optimized to capture biological patterns unique to nucleic acids.
**Why is character-level tokenization used instead of word-level tokenization?**
Character-level tokenization with a vocabulary size of 25 provides maximal granularity without merge operations, which is well-suited to the relatively small RNA alphabet. This preserves the identity of each individual nucleotide and ambiguity code, preventing information loss that could occur with subword tokenization.
**How does the model handle RNA sequences of varying lengths?**
The model uses learned positional encodings to capture position-specific information regardless of sequence length. Special padding tokens allow sequences of different lengths to be batched together during training, while the attention mechanism naturally handles variable-length inputs.
**What is the significance of dual masking strategies during pretraining?**
Combining token-level and subsequence-level masking encourages the model to learn both local patterns and higher-order sequence structures. The subsequence masking specifically targets biologically meaningful RNA motifs that often appear as short contiguous subsequences.
**Why are distance maps preferred over direct 3D coordinate prediction?**
Distance maps provide a translationally and rotationally invariant topological representation that is more stable to learn and more generalizable than predicting absolute 3D coordinates. They capture essential structural relationships while being computationally more tractable.
**How does the model evaluate secondary structure predictions when real RNA is flexible?**
The evaluation accepts predictions within one position of the true pairing as correct, acknowledging that RNA molecules are dynamic and not always in a single rigid conformation. This relaxed evaluation metric better reflects biological reality.
**What challenges does contact map prediction present compared to image segmentation?**
Contact maps must preserve native sequence dimensions rather than being resized, incorporate complex sequential and pairwise features rather than simple pixel intensities, and contend with extreme class imbalance where positive contacts constitute less than 2% of all predictions.
**How does the model detect shuffled or corrupted RNA sequences?**
The pretrained model’s embeddings are passed through a classification head that learns to distinguish authentic RNA from shuffled variants. The model’s ability to detect shuffling provides insight into whether it has learned meaningful biological constraints of RNA structure.
**Can coevolution analysis be performed from a single sequence?**
Yes, through the MLI framework, the model can infer coevolution-like couplings from individual sequences without requiring multiple sequence alignments. This is achieved by measuring how masking one position affects predictions at another position within the same sequence.
**What types of RNA sequences were used for pretraining?**
The model was pretrained on non-coding RNA sequences, which were filtered from a database of approximately 1.7 billion sequences to yield roughly 30 million high-quality non-coding RNA sequences for training.
## Conclusion
NucleicBERT represents a significant advancement in the application of deep learning to RNA biology. By combining a carefully designed transformer architecture with biologically informed pretraining strategies, the model learns rich representations that transfer effectively across a wide range of downstream tasks. From secondary and tertiary structure prediction to splice-site identification and fitness estimation, the model demonstrates versatility and performance competitive with specialized tools for each individual task.
The integration of coevolution analysis capabilities directly from single sequences opens new avenues for understanding RNA structural constraints without requiring large multiple sequence alignments. Similarly, the model’s ability to detect shuffled sequences reveals its capacity to learn genuine biological patterns rather than superficial sequence statistics.
As RNA therapeutics continue to expand and our understanding of non-coding RNA biology deepens, tools like NucleicBERT will play increasingly important roles in both basic research and applied biotechnology. The publicly available model and datasets provide a foundation for future innovation in computational RNA science.
Thank you for reading
