



# Understanding Linear Discriminant Analysis: A Complete Guide to Supervised Dimensionality Reduction
## What Is Linear Discriminant Analysis?
Linear Discriminant Analysis, commonly abbreviated as LDA, is a supervised machine learning method designed to uncover the most meaningful patterns within a dataset. Unlike unsupervised approaches, LDA leverages labeled data — meaning it knows which observations belong to which category — to find the directions in feature space that best separate those categories from one another.
At its core, LDA serves two primary purposes: dimensionality reduction and class discrimination. When faced with datasets containing dozens, hundreds, or even thousands of features, LDA distills this complexity down into a smaller set of components that retain the information most relevant to distinguishing between classes. This makes it an indispensable tool in the preprocessing pipeline of classification workflows.
### A Brief History
LDA is also known in academic literature as Fisher’s Linear Discriminant, named after the statistician Ronald A. Fisher, who introduced the criterion that the method seeks to optimize. Fisher’s insight was to define a measure — the ratio of between-class variance to within-class variance — that, when maximized, yields the directions along which classes are most distinct. This principle has remained central to LDA for nearly a century.
—
## How LDA Works: The Core Idea
Imagine you have a dataset with dozens of measurements for each observation. Each observation falls into one of several predefined groups. The challenge is twofold: how do you represent this data more compactly, and how do you ensure that the groups remain clearly distinguishable after this compression?
LDA addresses both challenges simultaneously. It transforms the original high-dimensional feature space into a new space defined by linear discriminants — these are directions (or axes) that maximize the separation between group means while minimizing the spread within each group.
### What Are Linear Discriminants?
Linear discriminants are new composite variables created by taking weighted combinations of the original features. The weights, or coefficients, are chosen so that the resulting variables capture the directions in the data where class differences are most pronounced. After transformation, each observation is represented not by its original measurements, but by its coordinates along these discriminants.
Crucially, even though the number of variables shrinks dramatically, the essential structure that differentiates the classes is preserved. It is akin to converting a symphony performed by a full orchestra into a compressed audio format — the richness of the experience is maintained, even though the underlying representation is far simpler.
—
## The Three Key Assumptions of LDA
For LDA to produce reliable and meaningful results, the data must satisfy three fundamental assumptions:
### 1. Linear Separability
LDA assumes that the boundaries separating different classes are linear — that is, they can be described by straight lines (or hyperplanes in higher dimensions). When class boundaries are curved or follow complex, nonlinear shapes, LDA may fail to capture the true structure of the data. In such cases, alternative nonlinear methods are likely to yield better results.
### 2. Gaussian Distribution of Features
Each class is assumed to follow a multivariate Gaussian (Normal) distribution. This means that within each group, the features are distributed in a bell-curve-like pattern. When this assumption holds, the statistical derivations underlying LDA’s discriminant functions are well justified. When it does not, the method’s performance can degrade.
### 3. Equal Covariance Matrices Across Classes
LDA assumes that all classes share the same covariance structure — that is, the same spread and the same pattern of correlations among features. This shared covariance matrix is often referred to as the pooled within-class covariance matrix. This assumption is what allows LDA to pool information across classes to estimate a single, robust measure of variability.
—
## The Mathematical Foundation
At a high level, LDA approximates the Bayes optimal classifier. The Bayes classifier assigns a new observation to the class that has the highest posterior probability — the probability that the observation belongs to a particular class, given its feature values.
LDA makes this practical by using estimates derived from the training data:
– **Prior probabilities** — estimated as the proportion of training samples belonging to each class.
– **Class means** — the average feature vector for each class.
– **Shared covariance matrix** — a pooled estimate of variability across all classes.
Using these estimates, LDA computes a discriminant score for each class and each observation. The observation is then assigned to the class with the highest discriminant score. In the multivariate case, these discriminant scores take the form of linear functions of the feature vector, hence the name Linear Discriminant Analysis.
—
## Why Use LDA? The Practical Benefits
### Computational Efficiency
Training a classifier on a dataset with thousands of features demands significant computational resources — more memory, more processing power, and more time. By reducing the feature space to a handful of discriminants, LDA dramatically lowers the computational burden of subsequent modeling steps without sacrificing class-discriminatory information.
### Removal of Redundant Features
Because LDA maximizes between-class variance and minimizes within-class variance, features that do not contribute to class separation naturally receive lower weights or are effectively discarded. This means redundant or irrelevant features are filtered out, leading to a cleaner and more interpretable model.
### Mitigation of Overfitting
High-dimensional datasets are prone to overfitting, where a model learns noise rather than genuine patterns. By projecting the data onto a lower-dimensional subspace focused on class separation, LDA helps ensure that the model captures signal rather than spurious correlations.
### Enhanced Interpretability and Visualization
When data has more than three features, direct visualization becomes impossible. LDA reduces the data to a small number of components that can be plotted in two or three dimensions, making it possible to visually inspect class clusters and separation boundaries. Because each discriminant is a linear combination of the original features, the contribution of each original feature to each discriminant can be traced and interpreted.
—
## LDA vs. PCA: What Sets Them Apart?
Principal Component Analysis (PCA) and Linear Discriminant Analysis (LDA) are often mentioned together, but they serve fundamentally different purposes.
| Aspect | PCA | LDA |
|—|—|—|
| **Learning Type** | Unsupervised | Supervised |
| **Uses Labels?** | No | Yes |
| **Goal** | Maximize overall variance | Maximize class separation |
| **Output Axes** | Principal Components | Linear Discriminants |
| **Max Components** | Equal to number of features | K − 1 (where K = number of classes) |
PCA finds the directions of greatest variance in the entire dataset, regardless of class labels. LDA, by contrast, finds the directions that best discriminate among known classes. This supervision gives LDA a significant edge for classification-oriented dimensionality reduction.
Additionally, PCA does not impose a limit on the number of components you can extract — you can keep as many as there are features. LDA is inherently limited to at most K − 1 components, where K is the number of classes. For many practical problems, this is not a constraint, since a small number of discriminants often captures nearly all the class-separating information.
—
## A Walkthrough: Classifying Property Types
Consider a real estate dataset containing detailed measurements of properties — square footage, number of bedrooms, number of bathrooms, proximity to schools, presence of a garage, and so on. Each property is labeled as one of three types: apartment, condominium, or single-family house.
With so many features, it is difficult to understand what distinguishes these property types or to visualize how they cluster together. Applying LDA to this dataset accomplishes several things at once:
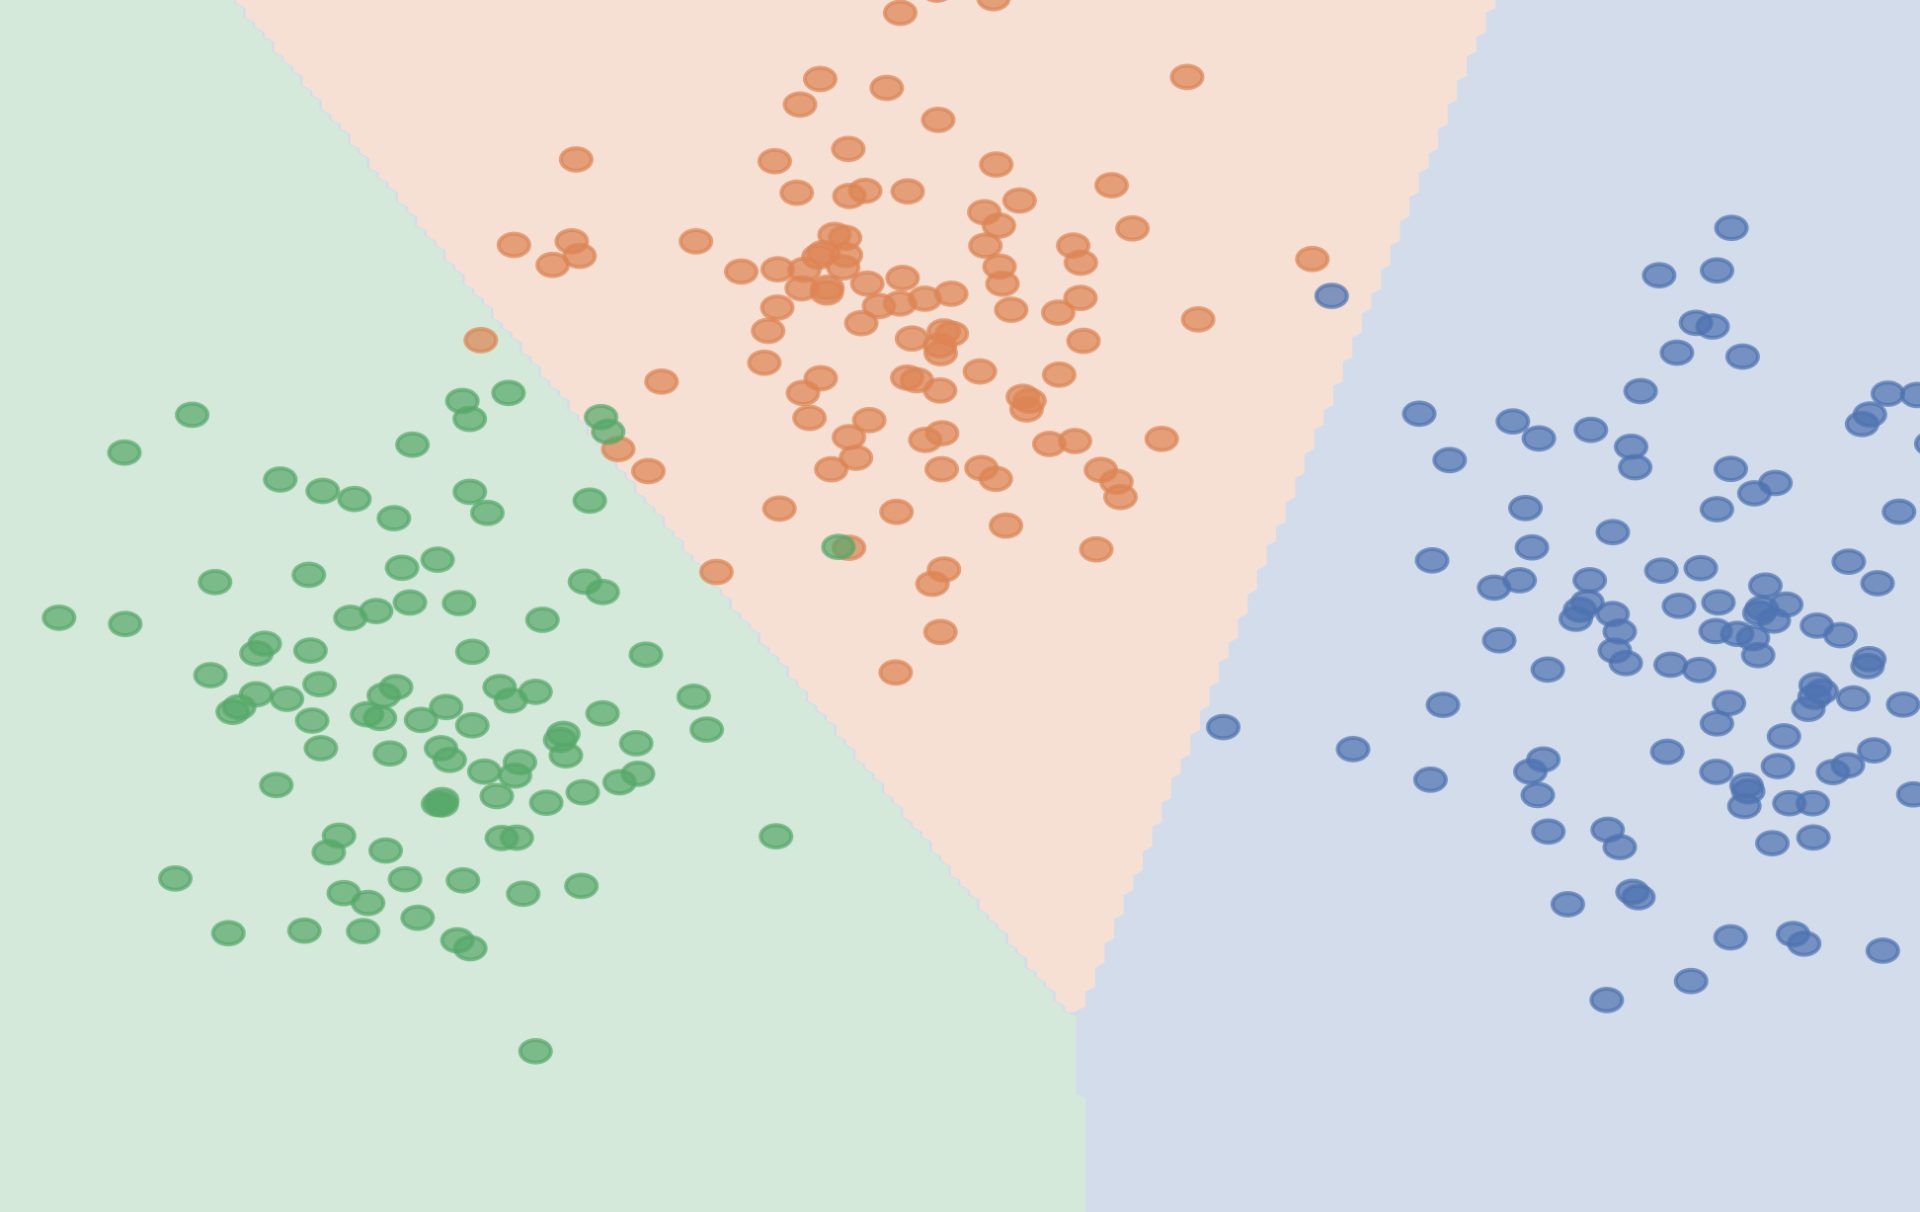
1. **Dimensionality Reduction**: The original set of features is projected onto two linear discriminants, which can be plotted in a two-dimensional scatter plot. This makes it possible to see, at a glance, whether apartments cluster separately from single-family houses, and where condominiums fall in relation to the other two groups.
2. **Decision Boundaries**: By fitting an LDA classifier on the reduced two-dimensional representation, approximate decision boundaries can be drawn, showing the regions of the feature space assigned to each property type.
3. **Feature Contribution Analysis**: LDA provides a measure of how much each original feature contributes to each discriminant. This reveals, for example, that the number of bedrooms and the distance to the nearest school may be the most influential features in separating condominiums from other property types.
4. **Explained Variance**: The explained variance ratio for each discriminant quantifies how much of the class separation is captured by that component. Often, the first discriminant alone accounts for the vast majority of the separation, confirming that the most critical distinctions in the data are captured in a single dimension.
These insights empower stakeholders — whether real estate agents, urban planners, or data analysts — to understand the characteristics that drive property classification and to communicate findings in an accessible visual format.
—
## Limitations to Keep in Mind
LDA’s effectiveness is tightly coupled to its assumptions. When data is noisy, sparse, or exhibits nonlinear class boundaries, LDA may underperform. In high-dimensional settings where the number of features greatly exceeds the number of observations, the estimation of the covariance matrix can become unstable, leading to unreliable discriminants.
For datasets that violate the Gaussian or equal-covariance assumptions, extensions such as Quadratic Discriminant Analysis (QDA) or regularized variants of LDA can provide more robust alternatives. It is always advisable to explore the data, check assumptions, and consider multiple methods before settling on a final approach.
—
## Frequently Asked Questions
### What is the difference between LDA and QDA?
Linear Discriminant Analysis assumes that all classes share the same covariance matrix, while Quadratic Discriminant Analysis (QDA) allows each class to have its own covariance matrix. This makes QDA more flexible but also more prone to overfitting when the training data is limited.
### Can LDA be used for binary classification?
Yes. In fact, LDA was originally developed with two-class problems in mind. For a binary classification task, LDA produces a single linear discriminant that defines the optimal separating boundary between the two classes.
### How do I choose the number of discriminants to keep?
The maximum number of discriminants is the smaller of the number of features or the number of classes minus one. In practice, you can examine the explained variance ratio for each discriminant and retain only those that account for a meaningful proportion of the class separation.
### Does LDA require the data to be normalized before application?
LDA does not mathematically require normalization, but it is often recommended in practice. Features measured on different scales can distort the covariance estimates, and normalization ensures that each feature contributes proportionally to the analysis.
### Is LDA suitable for very high-dimensional data, such as text or genomics?
LDA can be applied to high-dimensional data, but when the number of features far exceeds the number of samples, the covariance matrix estimation becomes unreliable. Regularized LDA variants or combining LDA with a preliminary feature selection step can help address this challenge.
### Can LDA be used as a standalone classifier, or only for preprocessing?
LDA can function as both a dimensionality reduction technique and a standalone classifier. When used as a classifier, it assigns new observations to the class with the highest discriminant score. However, it is most commonly employed as a preprocessing step before feeding the reduced feature set into another classifier such as logistic regression or a support vector machine.
### What happens if the classes are not linearly separable?
If class boundaries are nonlinear, LDA will still produce discriminants, but they may not effectively capture the true separation structure. In such cases, nonlinear dimensionality reduction techniques or kernel methods are better suited.
—
## Conclusion
Linear Discriminant Analysis remains a powerful, interpretable, and computationally efficient tool for supervised dimensionality reduction and classification. By projecting high-dimensional data onto a smaller set of axes that maximize class separation, LDA enables clearer visualization, faster computation, and more robust models. Its foundations in well-understood statistical principles — the Gaussian distribution, covariance estimation, and Bayes decision theory — give it a strong theoretical basis, while its practical utility in fields ranging from image recognition to real estate analytics underscores its enduring relevance.
As with any technique, understanding its assumptions and limitations is key to applying it effectively. When those assumptions are reasonably met, LDA provides an elegant bridge between complex, high-dimensional data and actionable, interpretable insights.
Thank you for reading
