



**From Load to Usable: How Learning dbt Fixed My Data Pipeline**
In my earlier article, I shared a 12-month roadmap to transition from data analyst to data engineer and outlined the first two months of building ETL pipelines: one pulling GitHub repo data into SQLite, and another pulling RSS articles into PostgreSQL with Docker and Kestra orchestration. At the time, I celebrated the ability to schedule the RSS pipeline to run automatically every hour, feeling a real milestone had been achieved. The data was flowing in on its own—no manual runs, no reminders needed.
However, some time later, when I ran a query on my own data for the first time, I realized a critical gap: while the data was technically loaded, it wasn’t usable. I couldn’t sort articles by date, identify which blogs published the most, or answer basic questions. The data pipeline was only half complete—there was no transformation, modeling, or structure to make the data meaningful. This article is about fixing that by learning dbt and understanding what “analysis-ready” data truly means.
—
### The Data Was Loaded. It Just Wasn’t Usable.
The schema of my `articles` table in PostgreSQL was simple:
“`sql
CREATE TABLE IF NOT EXISTS articles (
id TEXT PRIMARY KEY,
title TEXT NOT NULL,
link TEXT NOT NULL,
summary TEXT,
published TEXT
);
“`
The `published` column was stored as plain text rather than a timestamp, making date filtering and sorting unreliable. Additionally, every title followed a consistent pattern: “Author or Blog: Headline.” This valuable information was buried in a single text field, making it impossible to analyze blogs or filter by date without complex string manipulation in every query.
The problem wasn’t the pipelines; it was the lack of transformation and modeling. Loading had been the finish line, not the starting point.
—
### Why dbt, Specifically
My first instinct was to fix this in Python. But that would have meant writing another script—an untested, undocumented step that duplicated what I’d already built. dbt offers a better approach: it treats SQL as a version-controlled, tested, and documented part of the workflow. With dbt, I can define tests and assumptions that fail immediately if data quality breaks, rather than discovering the issue weeks later in a dashboard.
Learning dbt also aligns with industry practices—many data engineering job postings list it as a core tool. Fixing my RSS data was secondary to learning the tool itself.
—
### Setting Up (and Immediately Hitting a Wall)
Getting dbt running proved more challenging than expected. My system ran Python 3.14, but dbt officially supports up to 3.13. After creating a dedicated virtual environment with Python 3.12, installing `dbt-postgres` and connecting to my existing Postgres database was straightforward. A successful `dbt debug` confirmed the connection.
—
### Building the Staging Model
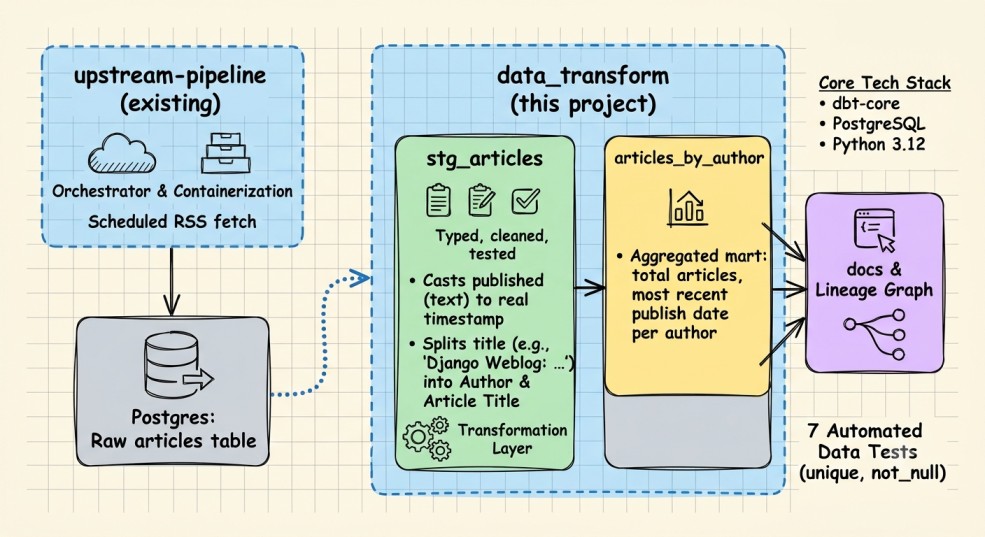
The first key concept in dbt was understanding sources versus models. Since my `articles` table existed outside dbt, I defined it as a source in `sources.yml`. My first staging model, `stg_articles`, fixed both core problems:
– **Date parsing**:
“`sql
to_timestamp(published, ‘Dy, DD Mon YYYY HH24:MI:SS OF’) as published_at
“`
– **Splitting title and author**:
“`sql
split_part(title, ‘:’, 1) as author,
trim(substring(title from position(‘:’ in title) + 1)) as article_title
“`
Running `dbt run` and querying the results confirmed clean, usable data. Dates were proper timestamps, and titles were correctly split.
—
### Adding Tests
dbt tests transformed this from a SQL exercise into engineering. By adding schema-level tests for uniqueness and null constraints, I ensured data quality:
“`yaml
columns:
– name: article_id
tests:
– unique
– not_null
– name: published_at
tests:
– not_null
“`
Running `dbt test` returned clear pass/fail results, catching potential issues early.
—
### Building a Mart and Asking Real Questions
With clean staging data, I built an aggregation model, `articles_by_author`, to answer practical questions:
“`sql
select
author,
count(*) as total_articles,
max(published_at) as most_recent_article,
min(published_at) as earliest_article
from {{ ref(‘stg_articles’) }}
group by author
order by total_articles desc
“`
The result was actionable: “Python Software Foundation” was the most active source, posting 5 articles with the most recent on July 9, 2026.
—
### Seeing the Whole Thing
Running `dbt docs generate` and `dbt docs serve` produced an interactive lineage graph, visually mapping data flow from raw input to final analysis—three clear nodes representing my complete transformation pipeline.
—
### Where This Leaves Me
Two clean models, seven passing tests, and a lineage graph later, the difference is undeniable. Same data, completely different usability. But this isn’t a finished product. It runs locally, depends on my laptop, and covers only one RSS feed. Alerts and monitoring remain untouched.
Still, the lesson is clear: loading data is not the end. True usability comes from transformation, testing, and structure—exactly what dbt enables. As I move toward externalizing and automating this stack, I’m confident these fundamentals will carry me forward.
Two months into a twelve-month roadmap, hitting these walls—and learning from them—feels exactly right.
—
### FAQ
**Q: Why didn’t you fix the date issue in Python instead of using dbt?**
A: While possible, fixing it in Python would have added another undocumented, untested step. dbt allows transformation to be version-controlled, tested, and integrated into the same workflow as extraction and loading.
**Q: What is the purpose of a staging model in dbt?**
A: A staging model cleans and structures raw data from sources without complex transformations. It ensures data is usable for downstream analysis and modeling.
**Q: How do dbt tests improve data quality?**
A: dbt tests validate assumptions about data—such as non-null fields or unique IDs—catching issues early instead of letting them propagate through pipelines.
**Q: Why is the lineage graph important?**
A: The lineage graph visualizes how data flows through transformations, helping teams understand dependencies and ensuring transparency in data pipelines.
**Q: What are the next steps for this project?**
A: The next challenge is moving the entire stack off the local machine—running it in a more permanent, automated environment with monitoring and alerting.
—
### Conclusion
This journey reinforced a crucial lesson: loading data is not the same as making data usable. By adopting dbt, I transformed raw RSS feeds into structured, tested, and query-ready models. The process highlighted the value of staging layers, automated testing, and documentation in building reliable data pipelines. While the current setup remains local and limited in scope, the skills and patterns learned here provide a solid foundation for scaling up. The transition from “data loaded” to “data usable” marks a significant milestone—and the next step in my roadmap is already in sight.
