




Modern software systems are becoming increasingly complex, and the tools we use to monitor them must evolve alongside them. When microservices became mainstream, distributed tracing emerged as an essential practice. Jaeger quickly became a go-to solution for engineers trying to make sense of these dispersed architectures. Today, as companies begin deploying generative AI applications and autonomous agents into live environments, the demands on tracing are transforming once more. Tracing an AI agent’s journey now involves following processes like prompt assembly, pulling data from vector databases, and orchestrating multiple third-party tool calls.
“Through the adoption of the Model Context Protocol (MCP), Agent Client Protocol (ACP), and Agent–User Interaction Protocol (AG-UI), Jaeger is creating a space where human engineers and AI agents can work together efficiently.”
Jaeger is advancing to meet the needs of these emerging workloads. This evolution unfolds in two key stages. First, Jaeger v2 was built from the ground up with native OpenTelemetry support at its core. Second, Jaeger is moving past simple data visualization. By embracing the Model Context Protocol (MCP), Agent Client Protocol (ACP), and Agent–User Interaction Protocol (AG-UI), the project is crafting a collaborative environment where engineers and AI agents can work side by side. This makes it possible to map out the intricate execution flows of AI pipelines that often push standard tracing tools to their limits.
Laying the groundwork with Jaeger v2
Handling AI workloads effectively starts with a streamlined data collection pipeline. This requirement drove the architectural overhaul outlined in the CNCF blog post, Jaeger v2 released: OpenTelemetry in the core!
Jaeger v2 swaps out its older collection methods for the OpenTelemetry Collector framework. This shift brings metrics, logs, and traces together under a single deployment model. With built-in support for the OpenTelemetry Protocol (OTLP), the system cuts out unnecessary translation layers and speeds up how data is ingested. This OpenTelemetry foundation sets the stage for more powerful tracing capabilities down the road.
Teaming up: humans and AI agents
Building on what Jaeger v2 offers, the project is finding new ways for teams to explore distributed systems. The aim is to make it easier for engineers and AI agents to collaborate during troubleshooting. Contributors from the CNCF LFX Mentorship program and Google Summer of Code (GSoC) are actively pushing this effort forward.
To enable AI integration, Jaeger is adopting three open standards: the Model Context Protocol (MCP), Agent Client Protocol (ACP), and Agent–User Interaction Protocol (AG-UI). MCP sets consistent rules for how AI models can safely connect to external data sources. ACP offers a standardized way for user interfaces to interact with AI agents and their sidecars. Together, these protocols turn Jaeger into an interactive workspace where both humans and AI can operate.
Constructing the backend protocol layer
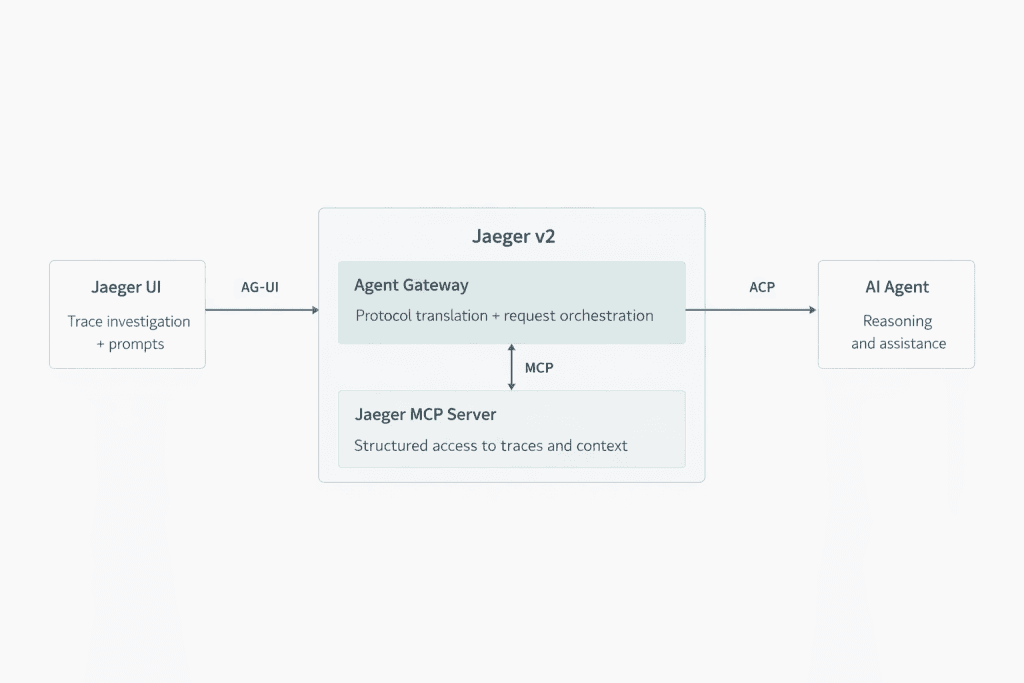
The implementation starts on the backend. An Agent Client Protocol layer is being built to serve as a stateless bridge connecting the Jaeger frontend with external AI sidecars. The full design and proof of concept are tracked in Jaeger backend issue #8252 (Implement AG-UI to ACP Jaeger AI) and issue #8295 (Implement ACP-based AI handler).
(Or
1
2
3
4
5
6
7
8
9
10
11
12
mermaid
graph LR
  J_UI["Jaeger UI"]
  AI_A["AI Agent"]
  subgraph JAEGER["Jaeger v2"]
    AGW["Agent Gateway"]
    JMCP["Jaeger MCP"]
  end

  J_UI -- "AG-UI Protocol" --> AGW
  AGW -- "ACP Protocol" --> AI_A
  AGW -- "MCP Protocol" <--> JMCP
)
Usually, when responding to incidents, engineers manually build queries by filtering through services and tags one by one. With ACP integration, the backend can interpret natural-language descriptions—such as spotting all 500-level errors in a payment service where response times exceed 2 seconds—and convert them into precise trace queries automatically.
Organizations can set up this backend to leverage cloud-based large language models (LLMs) for sophisticated analysis or opt for local small language models (SLMs) when keeping data on-premises is a priority. The sophistication of the analysis depends on whichever model is selected, as discussed in industry comparisons of hosted versus local AI infrastructure. By confining the AI’s responsibilities to protocol translation and query building, the design significantly reduces the risk of hallucinations commonly seen in open-ended chatbot systems.
A collaborative workspace in the UI
The Jaeger frontend is also being enhanced to work seamlessly with this new backend. As documented in Jaeger UI issue #3313, the codebase is being migrated from the older Redux pattern to the more modern Zustand plus React Query stack.
The updated interface includes an embedded assistant powered by assistant-ui and AG-UI. It uses streaming to forward trace-related context—such as error messages and key-value tags—to the backend gateway. This lets engineers ask the assistant to summarize an error path within a particular span, cutting down the time spent sifting through raw logs during an incident.
Charting GenAI execution paths
Beyond applying AI to analyze traditional traces, Jaeger is adding the ability to trace the AI applications themselves.
Tracked under Jaeger issue #8401 (GenAI integration), this initiative centers on visualizing the rapidly maturing OpenTelemetry GenAI semantic conventions. The OpenTelemetry community is actively working on standardizing telemetry for these highly dynamic workflows. Key efforts include draft specifications for Generative AI Agentic Systems (Issue #2664) to monitor tasks, memory, and actions, as well as conventions for AI Sandboxes (Issue #3583) to track short-lived code execution environments.
“Jaeger will represent these emerging standard operations directly in the UI, giving teams clear insight into AI execution paths while avoiding vendor lock-in.”
Developers building Retrieval-Augmented Generation (RAG) pipelines and autonomous agents need to monitor embedding model latency, track calls to external services, and keep an eye on token consumption. Jaeger will surface these new standard operations in its interface, giving teams transparent visibility into AI execution without locking them into any particular vendor’s format.
Consistent observability: from local testing to production
Keeping testing and production environments aligned is a common practical challenge. Jaeger originally gained popularity for its “all-in-one” executable that made local setup effortless. Since Jaeger v2 runs on the OpenTelemetry Collector, developers use the exact same binary in their local environment as they do in production.
During development, engineers can spin up a Jaeger v2 instance with a local SLM. This provides a fully private sandbox for experimenting with generative AI traces or working through ACP integration issues—all without sending data to any external services.
In production, platform teams deploy that identical unified binary, typically managed with tools like the OpenTelemetry Operator for Kubernetes. Organizations can then swap out the local SLM for a more powerful cloud-based LLM to handle real incident analysis at scale. This approach ensures tracing configurations stay consistent from a developer’s laptop all the way through to the production cluster.
Looking ahead
Tracing is evolving to keep pace with the growing complexity of AI-driven applications. With a robust OpenTelemetry foundation in Jaeger v2 and the integration of MCP and ACP standards, the project is repositioning its core capabilities accordingly. This roadmap gives teams a practical way forward where human engineers and AI agents team up to diagnose issues across distributed systems.
