



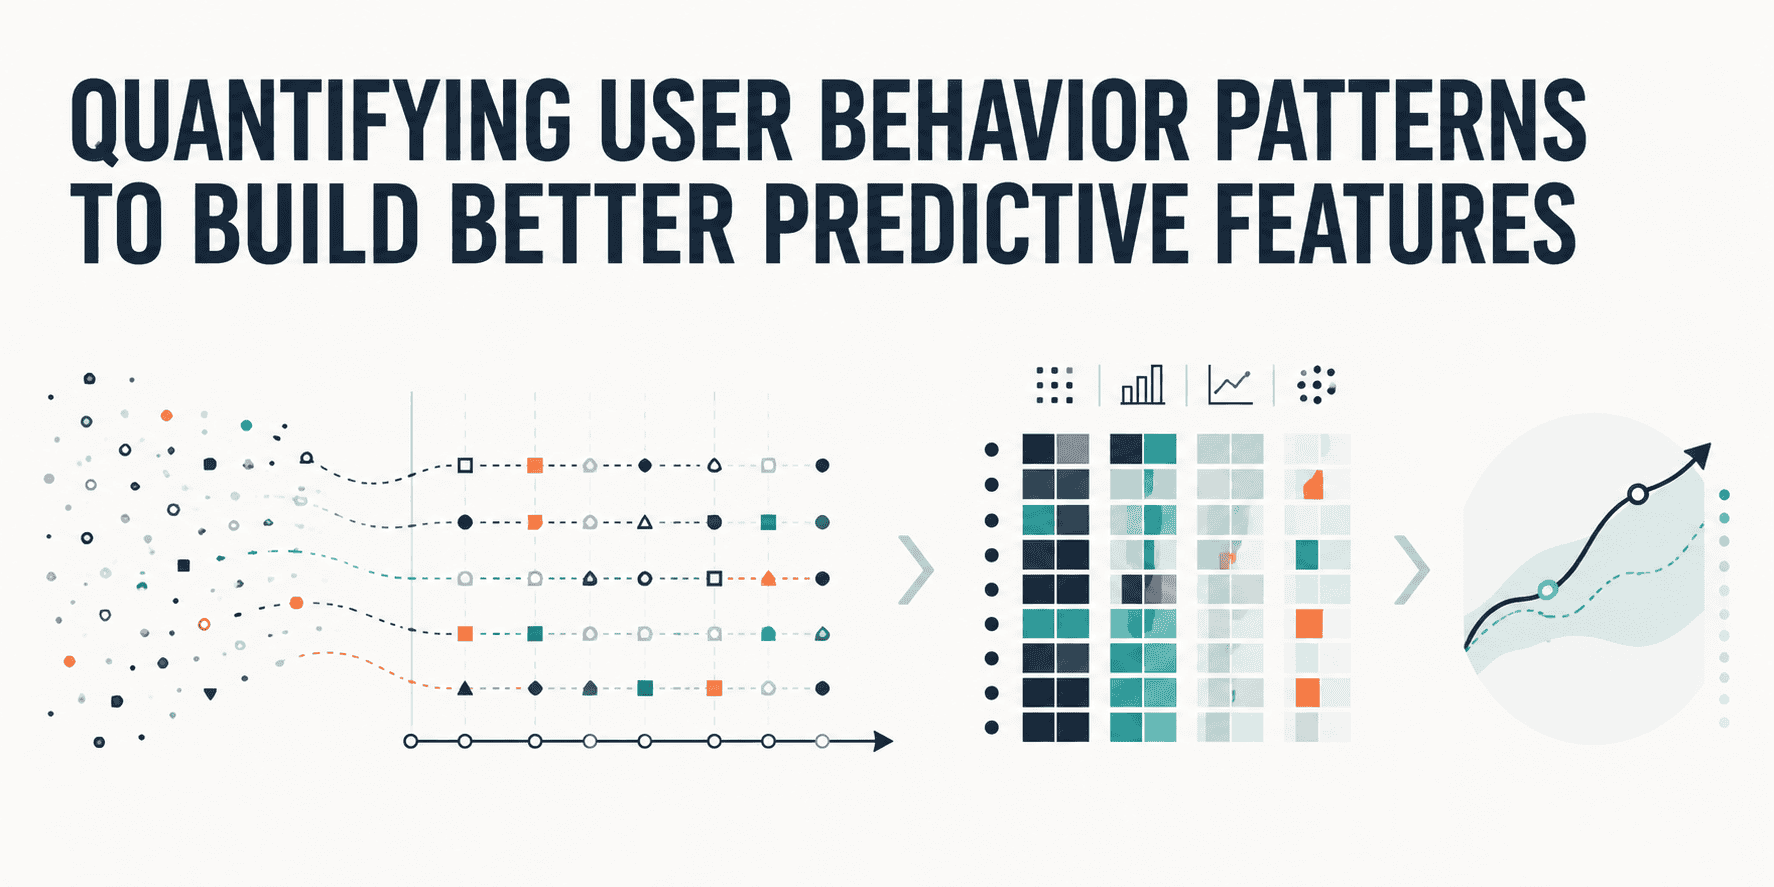
Unlocking Predictive Accuracy: Transforming Raw Events into Dynamic Behavioral Features
In the rapidly evolving field of machine learning, the shift from static modeling to dynamic pattern recognition has fundamentally changed how we understand customer interactions. Historically, systems relied on rigid demographic buckets and aggregate metrics to forecast user actions, but these traditional frameworks fail to capture the nuanced, ever-shifting nature of human decision-making. Knowing that a 35-year-old male in Seattle clicked 12 times last month tells you very little about his immediate intent or his likelihood to churn. As we move toward real-time diagnostics, the industry recognizes that complex user behaviors must be mapped as live, evolving signals rather than post-mortem snapshots. Research highlights that modeling behavior as time-dependent sequences captures predictive power that static features entirely miss, allowing systems to respond immediately to moment-to-moment shifts in interest.
To advance beyond simple click counts, data scientists now engineer features that quantify behavioral nuance by asking how actions cluster, accelerate, or stall across specific intervals. This transforms raw event streams into structured inputs models can learn from effectively.
The first core technique involves measuring behavioral velocity. By calculating action frequency within sliding windows—whether hourly, daily, or session-based—teams can detect surges that correlate with conversion or high activity. For example, a user who submits five queries in ten minutes displays a different intent profile than someone spreading those same five queries over a week. Session-based windows often perform best for software platforms, while hourly windows suit high-frequency transaction environments. More importantly, tracking the rate of change in activity between consecutive windows reveals shifts that predict retention better than absolute counts ever could. If session frequency doubles week-over-week, that acceleration signals positive momentum. When paired with recency metrics, these velocity features help distinguish active exploration from declining engagement, giving models a live pulse on user health.
The second technique focuses on engagement depth. This moves beyond surface-level interactions—like landing on a page or opening a modal—to track thorough participation, such as completing multi-step workflows or accessing advanced settings. Quantifying depth requires analyzing hierarchical navigation patterns and specific dwell times. Before training models, conducting thorough exploratory analysis is essential to identify patterns, gaps, and outliers. Studies show that identifying data quality remains a top priority for operational leaders before engineering begins, as robust analysis ensures the features deployed actually align with target outcomes. By surfacing exactly which usage behaviors matter most, teams can prioritize deep signals that drive performance and discard interactions that introduce noise.
The third technique evaluates resistance indicators, or friction. Metrics such as abandoned workflows, repeated form submissions, or prolonged hover times signal hesitation or error. Comparing expected versus actual path lengths reveals unnecessary detours; if an optimal workflow takes four steps but users average seven, that three-step delta becomes a valuable feature for predicting interventions before churn occurs. Tracking reversal actions, like navigating backward multiple times, helps surface areas where users experience friction points that require immediate attention.
Beneath these techniques lies a fascinating parallel between physical and digital environments. Research indicates that approximately 73% of purchasing decisions happen in physical retail settings, often driven by spontaneous visual cues and attractive displays. Digital platforms mirror this through prominent feature placement, visual salience, and contextual triggers that drive engagement reminiscent of in-store browsing. Modeling these micro-patterns—such as time spent on promotional banners or clicks following recommendation placements—allows systems to forecast which individuals are most susceptible to contextual nudges. When trained on these patterns, models enable real-time personalization by leveraging behavioral momentum to predict immediate conversion likelihood.
Handling sparse datasets remains another critical challenge. Real-world behavioral data is often overwhelmingly sparse, with power users generating rich streams while the long tail of infrequent visitors dominates with missing values. Traditional downsampling discards the exact signals needed at inference time. To solve this, zero-inflated exponential embeddings differentiate between structural gaps (those with no opportunity) and genuine disinterest, naturally downweighting instances without overwhelming the feature space. Additionally, sub-trajectory mining identifies common behavioral pathways across individuals, compressing large sequence spaces into predictable features. Instead of modeling every possible journey, this approach encodes whether someone followed a high-frequency path toward conversion or churn, maintaining temporal structure without combinatorial complexity.
In retail forecasting, this framework provides a practical backbone. Teams instrument pipelines to capture granular product page visits, cart additions, and wishlist updates, engineer velocity features around these actions, and track the speed of movement from browse to cart. Depth metrics reveal category exploration breadth, while friction analysis examines checkout reversals. By treating featured placements as digital equivalents of in-store displays, companies measure conversion rates within tight exposure windows. Applying zero-inflated embeddings handles minimal purchase history gracefully, and trajectory mining flags high-probability pathways for targeted interventions.
This approach transforms noisy event logs into structured signals, improving explainability and enabling models to predict current actions rather than relying on outdated historical snapshots. By surfacing interpretable behavioral patterns, we bridge the gap between raw data and operational intelligence, creating systems that understand not just who the user is, but what they intend to do right now.
FAQ
Q: What is the primary flaw of relying on traditional, static user profiles?
A: Static profiles reduce complex decision-makers to fixed demographics and aggregate metrics. They fail to capture the moment-to-moment shifts in intent, treating people as rigid entities rather than dynamic actors. By relying solely on historical snapshots like age or location, models miss the temporal dependencies between actions that signal genuine interest or imminent disengagement, resulting in predictions that cannot adapt to real-time behavioral changes.
Q: How is behavioral velocity different from simply counting clicks?
A: Velocity measures the pace and intensity of actions within dynamic time intervals, revealing whether engagement is accelerating or stalling. It captures the speed at which clusters of actions occur—such as submitting five queries in ten minutes versus spreading them over seven days—providing context to raw numbers. It highlights momentum shifts that static counts ignore, allowing models to distinguish between explosive interest and passive drifting by analyzing the rate of change between consecutive time windows rather than just totals.
Q: Why is engagement depth important for prediction?
A: Depth differentiates between passive views and active participation. Metrics like dwell time and hierarchical navigation reveal whether users are merely browsing or actively completing multi-step workflows. This granularity ensures models understand the quality of interaction, not just the quantity. Passive views often predict low-value outcomes, whereas deep engagement signals commitment, making these metrics vital for predicting retention and conversion beyond simple surface-level clicks.
Q: What role does data sparsity play, and how do modern embeddings solve it?
A: Deep data with many missing values often discards critical signals from infrequent users. Zero-inflated embeddings solve this by distinguishing between users who never had the chance to interact (structural zeros) versus those who chose not to engage (true disinterest). This preserves the long-tail insights necessary for effective recommendations on irregular or new visitors, ensuring models generalize beyond power users without artificially inflating feature importance.
Q: What is sub-trajectory mining?
A: It identifies common, recurring behavioral pathways across large populations, compressing complex sequence spaces into manageable patterns. By mapping the most frequent paths toward conversion or churn, it prevents combinatorial complexity while preserving temporal structure. This allows systems to flag high-probability journeys quickly, enabling real-time notifications and targeted interventions based on sequence matching rather than individual event analysis.
Conclusion
The transition from static profiles to dynamic behavioral features represents a fundamental shift in how we model user interactions. By combining velocity, depth, and friction indicators with techniques like zero-inflated embeddings and sub-trajectory mining, analysts convert noisy logs into live diagnostics that understand current intent rather than outdated demographics. This framework improves accuracy, enhances explainability, and enables real-time personalization by adapting instantly to user actions. Embracing these dynamic signals bridges the gap between raw data and actionable prediction, ensuring models reflect the fluid reality of human behavior while maintaining interpretable, structured insights for immediate operational value.
Thank you for reading
