



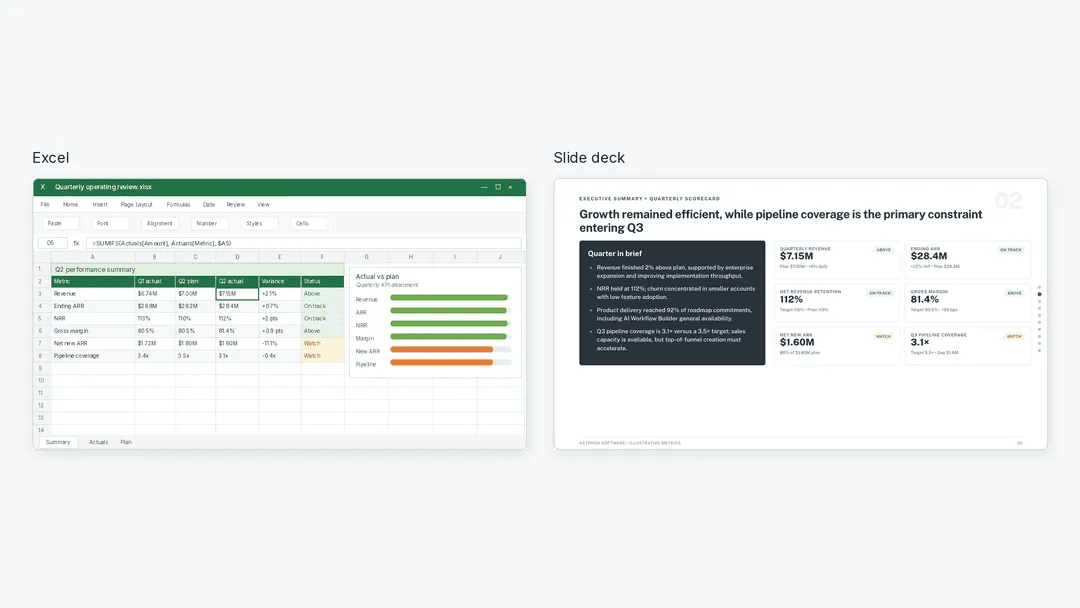
# From Spreadsheet to Slide Deck: A Step-by-Step Guide to AI-Powered Data Presentations
Putting a solid analysis into a PowerPoint can often take longer than the analysis itself. You already have the numbers, but you still need to decide which charts matter, write the narrative for the slides, and format a deck you’d actually be proud to send to a client or your team.
Using AI to turn Excel or CSV data into an editable PowerPoint can dramatically speed up this process. However, for a data-heavy presentation, it is best to break the work into a few deliberate steps rather than asking the AI for the finished deck all at once. By checking the data, working out what matters, and then providing the AI with a clear brief, you can create a professional presentation without sacrificing accuracy. Here is a workflow to turn your raw spreadsheet into a polished slide deck.
## 1. Start With the Question the Presentation Needs to Answer
Before you open a presentation builder, define the core question your audience needs answered. A vague prompt like “make a presentation about marketing performance” will yield generic results. Instead, focus on the decision your audience needs to make.
Are they looking to understand how revenue changed last quarter and identify areas that need investigation before setting the next budget? Or are they trying to understand which channel is underperforming? A precise question gives the AI a sharper lens through which to filter the data and ensures the resulting presentation is actionable.
## 2. Prepare and Verify the Source Data
AI models are only as good as the data they are fed, and they cannot tell the difference between clean and messy data on their own. Before uploading your workbook, you need to do a bit of housekeeping.
When prompting the AI to inspect your file, be specific. Ask it to read the workbook notes, confirm the reporting periods, verify the units of measurement, and clarify what each row represents. Have it flag any missing values, duplicate records, or ambiguous entries.
It is also crucial to clarify definitions. The term “revenue” can mean booked revenue, cash collected, or pipeline value depending on your organization. If the definition is missing from the file, clarify it before asking the AI to draw any conclusions. Keep any reference calculations separate from your source data to avoid accidental double-counting.
## 3. Perform and Validate the Calculations
Once the inputs are clear, ask the AI to handle the math, but do not let it jump to conclusions yet. Prompt the AI to calculate totals, percentage changes, and channel contributions based strictly on your source tabs.
For example, if you are reviewing marketing results, ask the AI to calculate the total attributed revenue for each quarter, the shift in revenue by channel, and return metrics like revenue divided by advertising spend.
Crucially, ask the AI to show its work—specifically the formulas and source values used—and to compare its output against any reference sheets you may have. Always verify these key numbers yourself before moving forward. If a channel’s attributed revenue grew by 20% but the advertising spend for that channel increased by 80%, the AI should highlight that the return on ad spend has diminished. This nuance is where the real insight lies, and it is a detail a rushed AI prompt might skip over.
## 4. Turn the Findings Into a Presentation Brief
Now that you have verified the numbers, you can ask the AI to generate the deck. The prompt for this step should include the audience, the expected meeting length, the main findings, and the limitations of the data.
Request specific visuals, such as a grouped bar chart comparing revenue by channel across the two quarters, and a clear table showing advertising spend and return metrics. Ask for “takeaway titles” on each slide—headlines that summarize the point of the slide without requiring the audience to read the chart.
Be firm about what the AI should not do. Instruct it not to invent causes, benchmarks, forecasts, or missing costs. If the data does not explain why a particular metric declined, the AI should flag that as a question for investigation rather than guessing. Ask for a consistent layout, readable labels, and brand-specific colors if applicable, and ensure the final output is fully editable.
## 5. Download, Inspect, and Refine the Export
AI-generated slides are starting points, not final drafts. Download the presentation and open it in your native software before sending it to anyone else.
Check that the totals still match your manual calculations, that chart labels are readable, and that the slide titles accurately reflect the data presented. Make sure source notes and data qualifications haven’t disappeared during the AI’s design revisions. If you find areas that need adjustment, use a specific follow-up prompt to revise the content, visuals, or structure. For instance, you might ask the AI to make a specific metric more prominent or to remove a claim that isn’t supported by the underlying data.
Reviewing the exported file is a small step that prevents miscommunication and ensures that what you present is exactly what you analyzed.
## FAQ
**Q: Why shouldn’t I just tell the AI to “make a presentation about my Excel file”?**
A: Vague prompts lead to generic decks that may prioritize the wrong data or hallucinate insights. By breaking the process into steps—defining the question, verifying the data, validating the calculations, and issuing a detailed brief—you ensure the final presentation is accurate, focused, and actionable.
**Q: What should I do if my Excel file has missing values or ambiguous column headers?**
A: Do not wait for the AI to generate slides. In the data preparation step, explicitly prompt the AI to flag these issues. You must clarify what the missing values mean or how ambiguous headers should be interpreted before the AI can reliably analyze or visualize the data.
**Q: Can I use this workflow to generate financial forecasts or future projections?**
A: It is best to exercise caution. The workflow described here focuses on analyzing verified, historical data. If you ask an AI to forecast future trends or invent profit margins that were not in your source file, you risk presenting unverified assumptions as fact. Stick to what the data actually shows, and keep recommendations separate from findings.
## Conclusion
Transforming raw data into a compelling presentation does not have to be a tedious manual process. By treating AI as a drafting tool rather than an oracle, you can maintain control over the accuracy of your numbers while saving hours of formatting time. Start with a single report, define a clear question, verify your calculations, and use a detailed brief to guide the deck creation. This structured approach allows you to leverage the speed of AI without sacrificing the rigor of your analysis.
Thank you for reading
