



**Running Local LLMs on Apple Silicon: Cost, Throughput, and the Big Model Surprise**
Running large language models on your own hardware is compelling because it’s essentially free after the machine purchase—you cover a tiny electricity cost, and every token generated afterward is pure upside. A recent piece put numbers to this by measuring the power draw of an RTX 3090 and applying real-world electricity tariffs. The most interesting finding: the most expensive model to run wasn’t the biggest one. Cost per token tracked through-put, not parameter count.
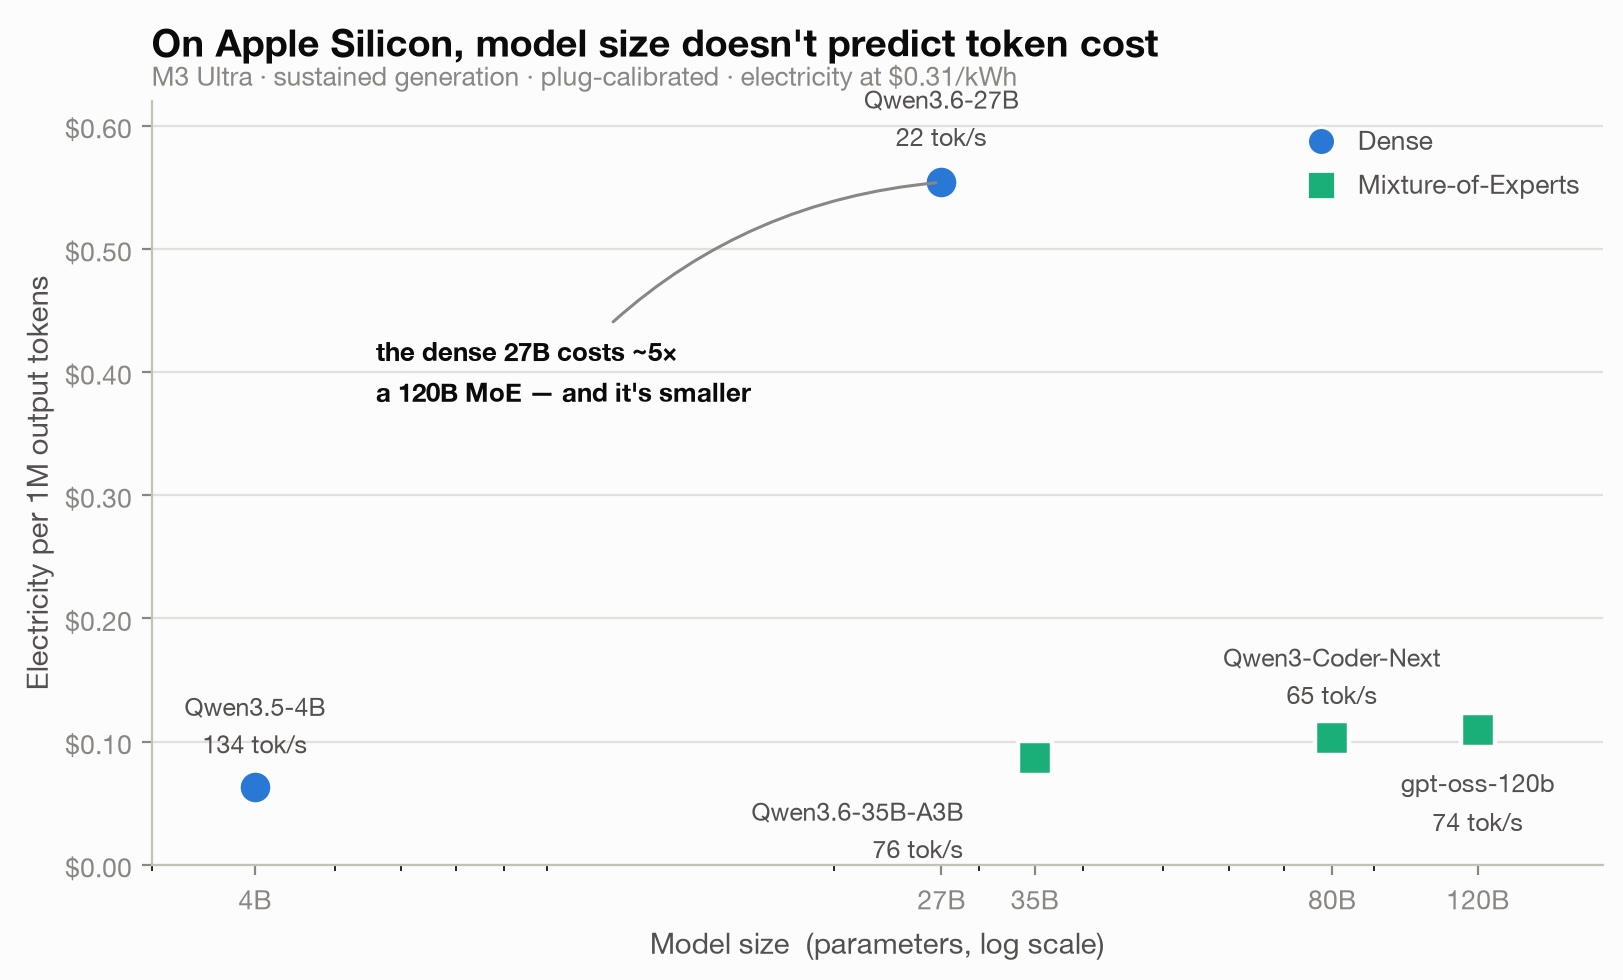
I don’t own a 3090. I run everything on an M3 Ultra Mac Studio with 96 GB of unified memory—no discrete GPU, no separate VRAM, just a single shared memory pool. That’s a meaningfully different architecture, so I wanted to know whether the same “cost surprises” hold on Apple Silicon, and by how much. Short answer: the surprise not only holds, it gets larger. My 120-billion-parameter model is about five times cheaper per token than a model a quarter its size.
Below, I’ll explain how I measured this and why the results land where they do. All figures are real wall-socket measurements with calibrated error bands.
—
### How the measurement works
The instrument is TokenWatt, an OpenAI-compatible proxy built specifically for Apple Silicon. It forwards requests byte-for-byte to whatever local inference server you run, while bracketing each request with energy readings taken directly from the chip via Apple’s IOReport interface—no `sudo` or external sensors required. It subtracts a rolling idle baseline so you measure the marginal cost of the request, not the power draw of an idle machine. Prices are applied at your electricity rate ($0.31/kWh in my case).
To ensure honesty, every measurement in this article was calibrated against ground truth: the Mac was plugged into a Shelly Plug US Gen4 that meters actual energy at the wall. TokenWatt’s built-in calibration fit the SoC counters to the plug readings without manual tuning, and anyone with a metering plug can repeat the process. Each figure below has a stated uncertainty between ±2.6% and ±4.5%.
For headline numbers, each model ran in a sustained generation loop—nothing but token decoding—at three durations (120, 360, and 720 seconds), three passes each, with a 15-minute idle baseline between runs. This represents a best-case, saturated scenario.
—
### The five models tested
All models fit within 96 GB of unified memory, which matters for the largest ones. The set spans from a 4-billion-parameter dense model to a 120-billion-parameter mixture-of-experts (MoE), covering different quantizations and architectures. “Footprint” is the memory occupied by weights; “tok/s” is sustained decode throughput. Costs are per million generated output tokens.
| Model | Params | Type | Footprint | tok/s | $/1M out |
|——-|——–|——|———–|——-|———-|
| Qwen3.5-4B | 4B | dense | 2.9 GB | 133.8 | $0.063 |
| Qwen3.6-35B-A3B | 35B | MoE (3B) | 35 GB | 76.0 | $0.087 |
| Qwen3-Coder-Next | ~80B | MoE (3B) | 60 GB | 65.0 | $0.103 |
| gpt-oss-120b | 120B | MoE (5B) | 59 GB | 74.0 | $0.109 |
| Qwen3.6-27B | 27B | dense | 28 GB | 21.5 | $0.554 |
I sorted the table by cost, not size, to highlight a key pattern: the cheapest model is the smallest, but the most expensive is the 27B dense model—smaller than three of the others yet up to nine times more expensive per token than larger alternatives. The 120B model undercuts it five-fold. Parameter count alone does not predict running cost; architecture and utilization do.

—
### Why the big model wins
The mechanism is the same as in the RTX 3090 analysis: the electricity cost per token equals watts divided by throughput. The 27B dense model loses on both dimensions: it draws the most power (138 W) and offers the lowest throughput (21.5 tok/s).
The reason is simple: on this hardware, generating a token requires reading every active weight out of memory. A dense 8-bit 27B model activates all 27 billion parameters for each token, streaming its entire ~28 GB footprint every step—high bytes-per-token and low speed, the worst combination.
Mixture-of-experts models break that pattern. gpt-oss-120b holds 120B parameters in memory, but only about 5B are activated per token. That means it reads a small fraction of its 59 GB per token, yielding higher speed (74 tok/s) and lower power (94 W). Quantization compounds the effect: these MoEs run at 4–6 bits versus 8 bits for the dense model, further reducing bytes-per-token. The result is a 120B model that is both cheaper and faster than a 27B dense model on the same machine.
The 4B model wins on cost because it is tiny and very fast (134 tok/s), but it occupies a different quality tier. Among models suitable for demanding tasks, well-quantized MoEs beat mid-size dense models on cost and throughput. If you pick by parameter count—“27B is smaller, so it must be cheaper”—you end up with the single most expensive option on the board.
—
### Does it hold with real traffic?
A sustained loop is a benchmark, not a real workload. It keeps the GPU pegged at 100% with no cold starts, no queuing, and no pauses. Real serving is lumpier, which generally raises the per-token cost relative to best-case sustained runs.
To check this, TokenWatt has logged my real inference traffic for 30 days across three of these models. These numbers are estimates (not wall-calibrated), but the ordering is clear:
| Model | Real traffic (30 days) | $/1M total tokens |
|——-|————————|——————-|
| Qwen3.6-27B (dense) | 3,788 req | ~$0.78 |
| Qwen3.6-35B-A3B (MoE) | 1,270 req | ~$0.071 |
| Qwen3-Coder-Next (MoE) | 933 req | ~$0.057 |
In the wild, the dense 27B costs roughly ten times more per token than the MoEs. Real traffic runs below saturation, which increases per-token cost relative to the best-case loop, but the shape is unchanged. The dense mid-size model remains the expensive one no matter how you slice it.
—
### Apple Silicon caveats
A few specifics matter if you’re reproducing this or evaluating your own setup:
– **Resident big models cost power even between tokens.** On unified-memory machines, tens of gigabytes of weights sit in system memory, consuming baseline bandwidth and regulator overhead. I measured this overhead climb with model size; it settles around 21 W as an asymptotic floor once a model is large enough.
– **96 GB is a practical ceiling.** My 120B MXFP4 model occupies ~59 GB; add the OS and KV cache and you’re near the limit of a 96 GB Mac Studio. MoEs must hold all experts in memory even though only a subset activates per token, so footprint equals full model size. Larger unified-memory machines could comfortably host models beyond 120B, and the same watts-throughput principles would apply. Models that don’t fit must be offloaded, which changes the economics dramatically.
– **This measures marginal electricity only.** It excludes the cost of the Mac itself—by far the larger portion of TCO—amortized over thousands of requests. The energy floor is small compared to hardware, but it’s the correct unit for comparing models.
– **Cloud cost context.** For scale, hosted “cheap” endpoints range from $1.25/M tokens (GPT-5.4-nano) to $5 for Claude Haiku 4.5. My electricity figures range from $0.06 (4B) to $0.55 (27B). The comparison favors local, but it’s not a ten-times win when you amortize hardware; it’s a reminder that once the machine is bought, the variable cost of a token is low—and which model you pick swings it by an order of magnitude.
—
### The takeaway
Choose the smallest, fastest model that meets your quality threshold. That advice stands on both RTX 3090 and Apple Silicon. What Apple Silicon adds is a sharper corollary: because unified memory lets large MoE models fit, and because MoEs activate only a fraction of their weights per token, a well-quantized 120B model can be cheaper and faster than a smaller dense one. Don’t pick by parameter count. Pick by measured throughput and let the numbers decide.
One caveat: cost only matters among models that actually work for your task. In agentic tool-calling workloads, I’ve found Qwen3.6 models more reliable than similarly sized Gemma variants, which never earned a place in my loop or this table. Clear the quality bar first; then let cost and throughput break the tie. The next frontier for me is measuring how well models handle real tool-calling loops.
And measure your own—because your models and your rates differ from mine. TokenWatt is open source and sits in front of any local server you already run. Point it at your upstream, add your electricity rate, and it produces a per-request, per-model ledger with calibrated energy readings. I’d like to see these numbers reproduced across hardware and rates; the whole point of measuring is that you don’t have to take anyone’s word for it. You can find the repo at github.com/mmmugh/tokenwatt.
All figures above were measured on a Mac Studio (Apple M3 Ultra, 96 GB, macOS 26), wall-calibrated against a Shelly Plug US Gen4, priced at $0.31/kWh. Sustained-generation figures include ±2.6–4.5% uncertainty; real-traffic figures are uncalibrated estimates and are directional only. Costs reflect marginal electricity only and exclude hardware.
