




Key takeaways:
- Bitcoin faces mounting downward pressure as consistent net outflows from BTC-focused exchange-traded funds signal growing caution among institutional investors.
- The majority of leading altcoins continue to show weakness, pointing to bears currently dominating market direction.
Bitcoin (BTC) dipped below the $75,000 threshold on Wednesday, hinting that bears are steadily gaining traction in the digital currency space. Institutional players appear to be offloading their holdings, with bitcoin ETFs posting cumulative net outflows of $1.88 billion since May 15, according to data from Farside Investors. Glassnode noted in an X post that ongoing net outflows from BTC ETFs on almost every trading session since May 7 are adding selling pressure without any apparent buying activity to counterbalance it.
Bitcoin’s declining momentum has pushed it under its long-term valuation benchmark, as highlighted by Bitwise. The investment firm revealed in a report that historically, only 36% of BTC’s market-value-to-realized-value (MVRV) ratios have fallen below the current reading of 1.42. Meanwhile, about 99% of historical Nasdaq-100 price-to-book ratios sat beneath present levels, underscoring the largest-ever valuation gap between bitcoin and US technology equities.
Daily cryptocurrency market overview. Source: TradingView
While many investors are hitting the panic button, a large holder is viewing the dip as a chance to accumulate. Blockstream CEO Adam Back shared on X that a prominent whale has been scooping up 450 “discounted bitcoins” each day over the past eight and a half days, employing a time-weighted average price strategy.
Can bitcoin and several major altcoins manage to recover from their key support zones? Let’s dive into the price charts of the top 10 digital assets to get some answers.
Bitcoin forecast
Bitcoin reversed downward from the 20-day exponential moving average ($77,431) on Tuesday, suggesting sellers are capitalizing on brief price recoveries.
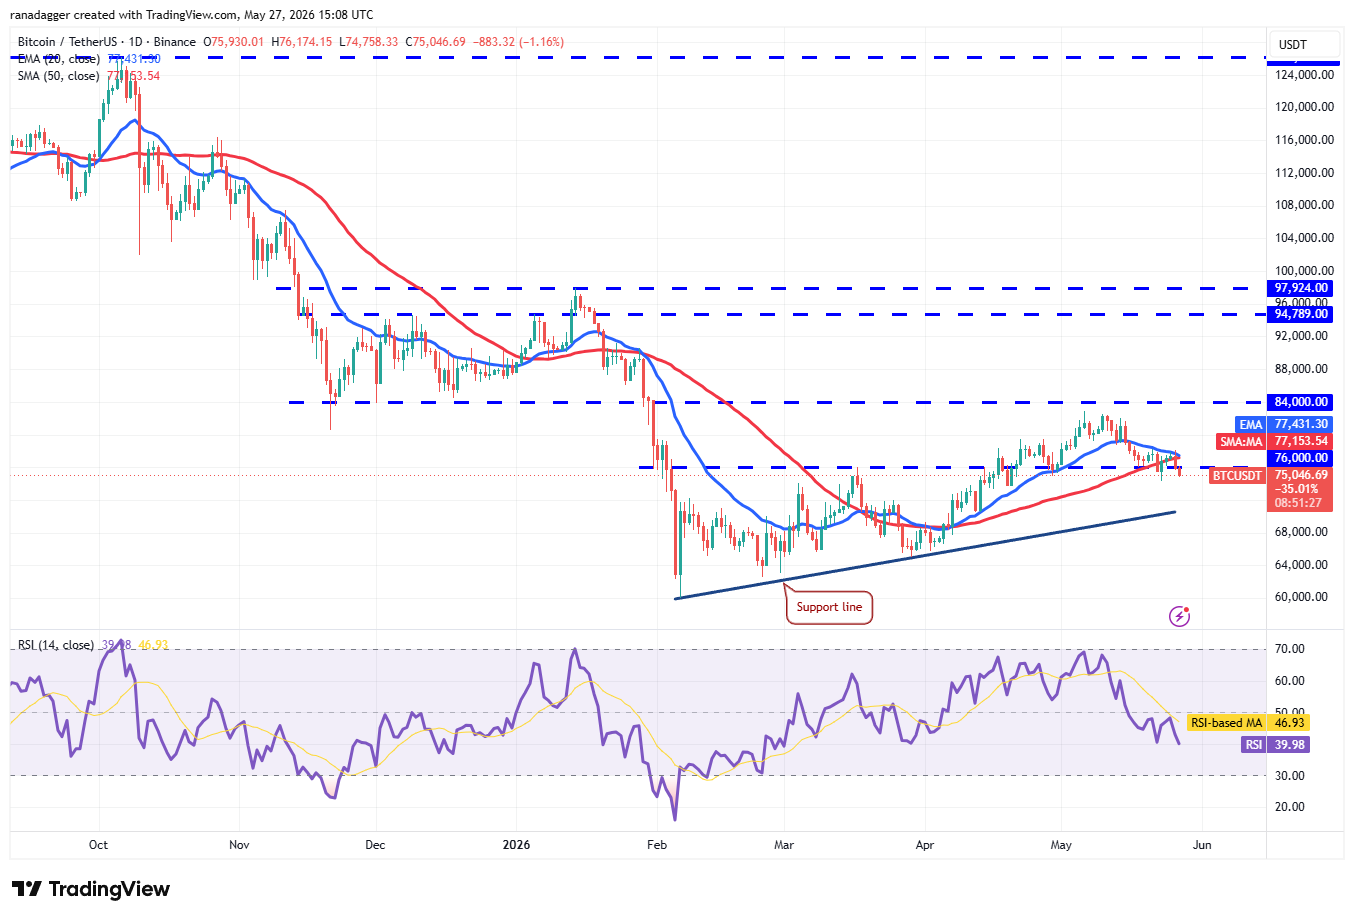
BTC/USDT daily chart. Source: Cointelegraph/TradingView
Bulls are expected to defend the critical $76,000–$74,289 support region, while bears will push to drag BTC below it. Should this support collapse, the short-term momentum would swing toward sellers. The BTC/USDT pairing could then tumble toward a support line near $70,500, which would likely entice buyers back in.
On the flip side, a rebound off that support zone would prompt bulls to renew their push above the 20-day EMA. A successful break above it could fuel a rally toward $82,000 and potentially on to $84,000.
Ethereum forecast
Buyers have been unable to lift Ether (ETH) back above the support line, signaling that bears are working to convert this level into resistance.
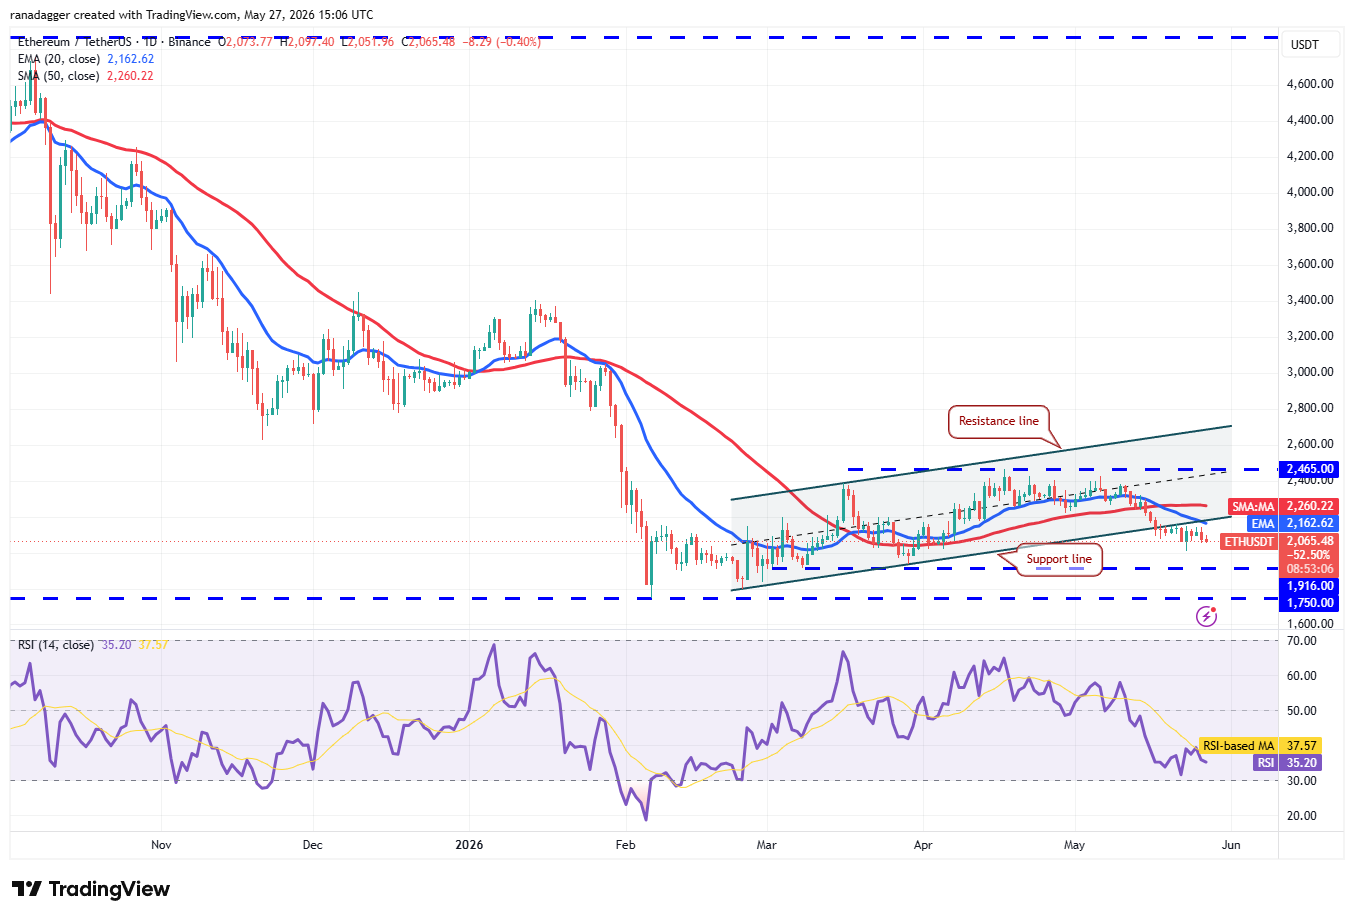
ETH/USDT daily chart. Source: Cointelegraph/TradingView
The $2,000 mark serves as a psychological floor, but if it gives way, the ETH/USDT pair could slide toward the $1,916–$1,750 range.
Buyers face a tough road ahead. They’d need to drive ETH above the moving averages to demonstrate renewed strength. Achieving that would signal the market has shrugged off the breakdown below the channel, raising the probability of a climb toward $2,465 and then to the channel’s resistance line.
BNB forecast
Buyers are trying to hold BNB (BNB) above its 20-day EMA ($652), but bears are maintaining upward pressure.
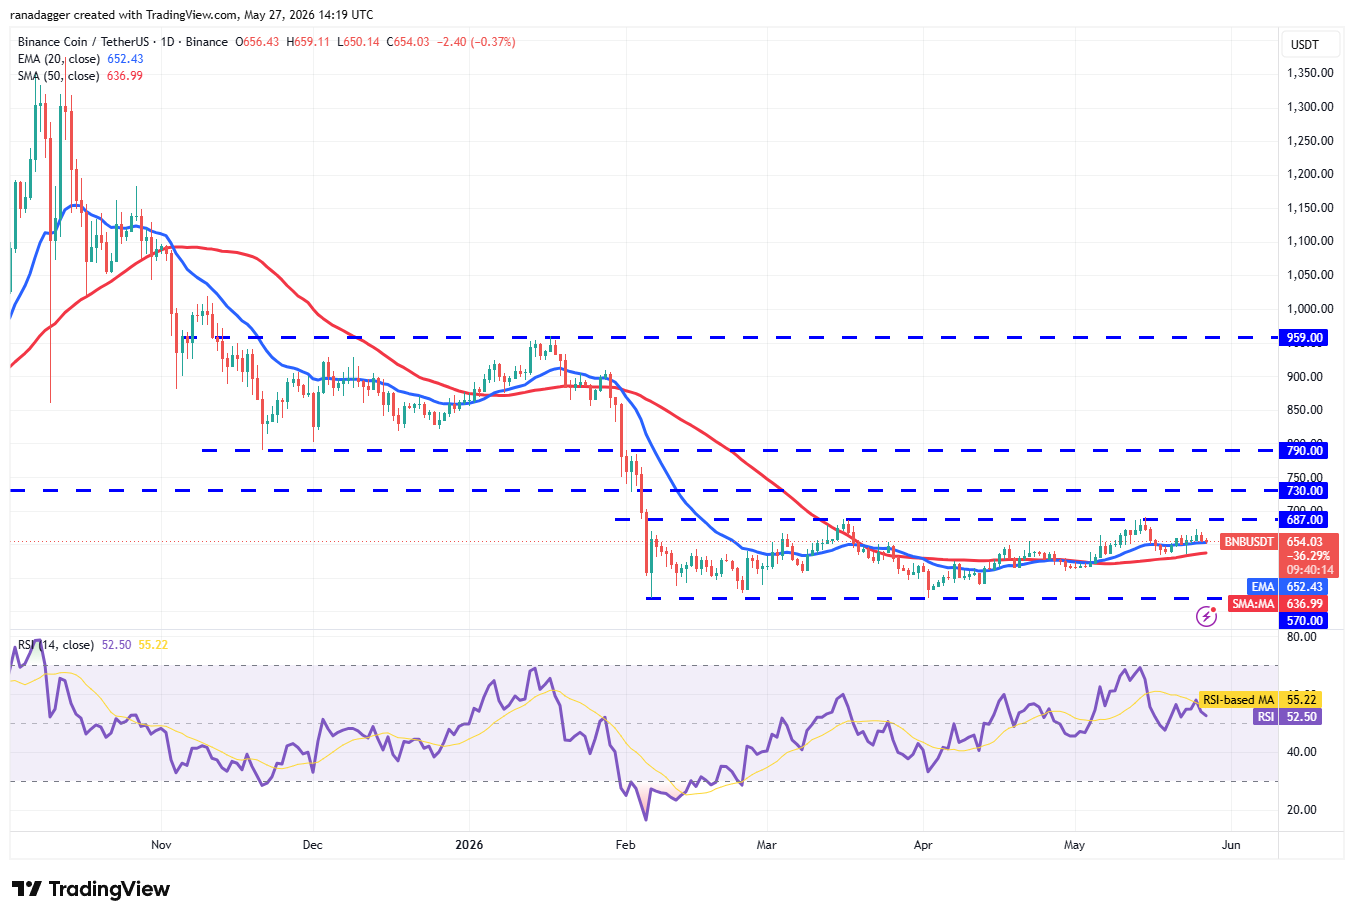
BNB/USDT daily chart. Source: Cointelegraph/TradingView
Should the 20-day EMA break, bears would aim to consolidate gains by dragging BNB below the 50-day simple moving average ($636). If successful, the BNB/USDT pair may plunge to $610 and further to $570.
Conversely, a bounce off the moving averages would suggest solid demand at lower price levels. Bulls would then reattempt to overcome the $687 overhead resistance. A breakout there could propel the pair toward $730 and onward to $790.
XRP forecast
XRP (XRP) continues drifting steadily toward the $1.27 support level, reinforcing that sellers remain in command.
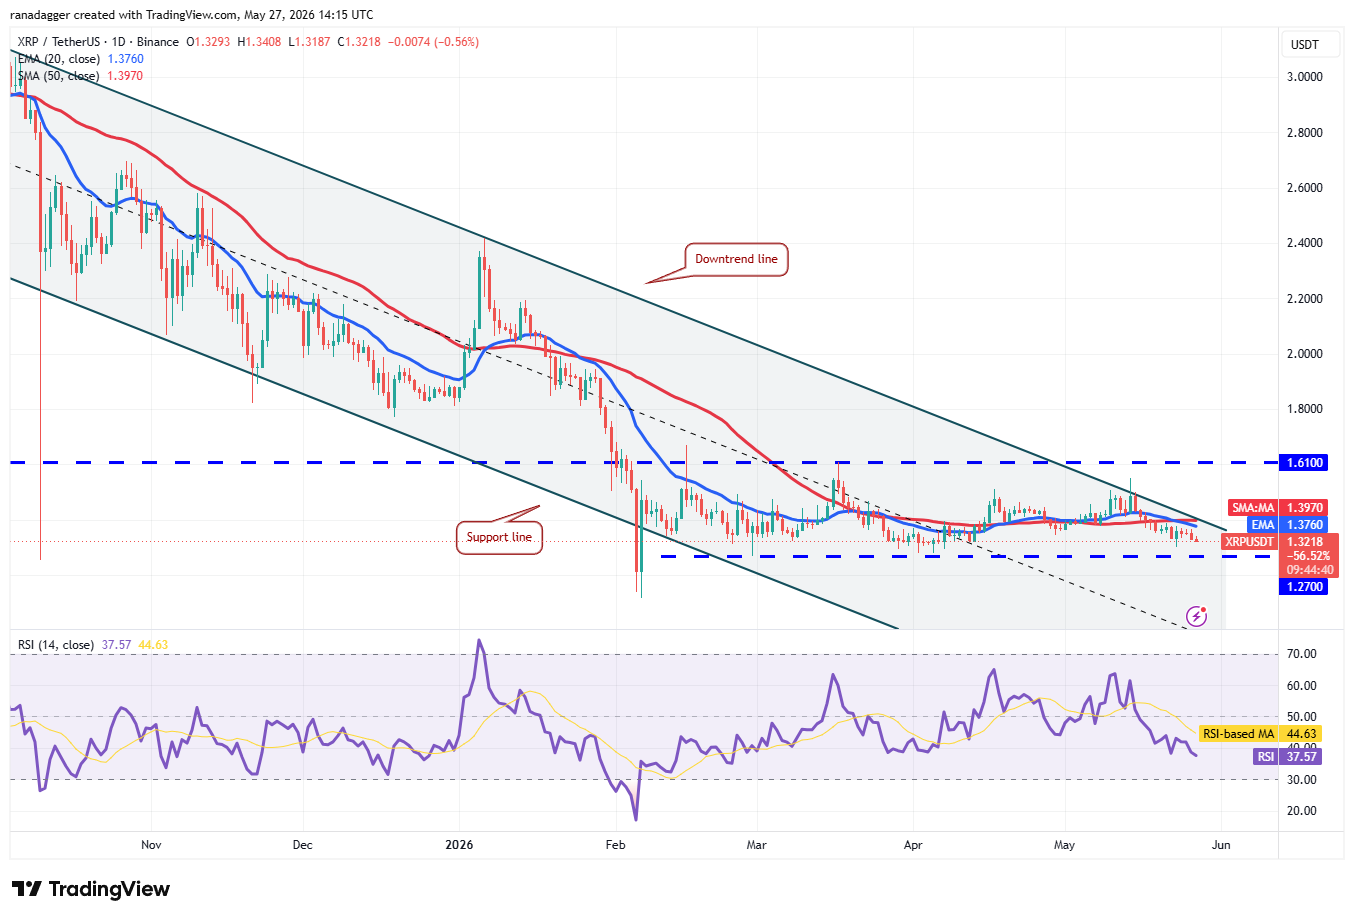
XRP/USDT daily chart. Source: Cointelegraph/TradingView
Buyers are anticipated to defend strongly around $1.27, but any relief rally is likely to encounter selling pressure at the 20-day EMA ($1.37) and subsequently at the downtrend line. A sharp rejection from the EMA heightens the chance of a breakdown below $1.27. If breached, the XRP/USDT pair may nosedive toward $1.11 and possibly down to $1.
The earliest signal of bullish strength would be a decisive close above the downtrend line. The pair could then advance toward the $1.61 resistance. Buyers must overcome this hurdle to suggest a potential shift in trend.
Solana forecast
Solana (SOL) remains compressed between the 20-day EMA ($86.42) and the $82.65 support level.
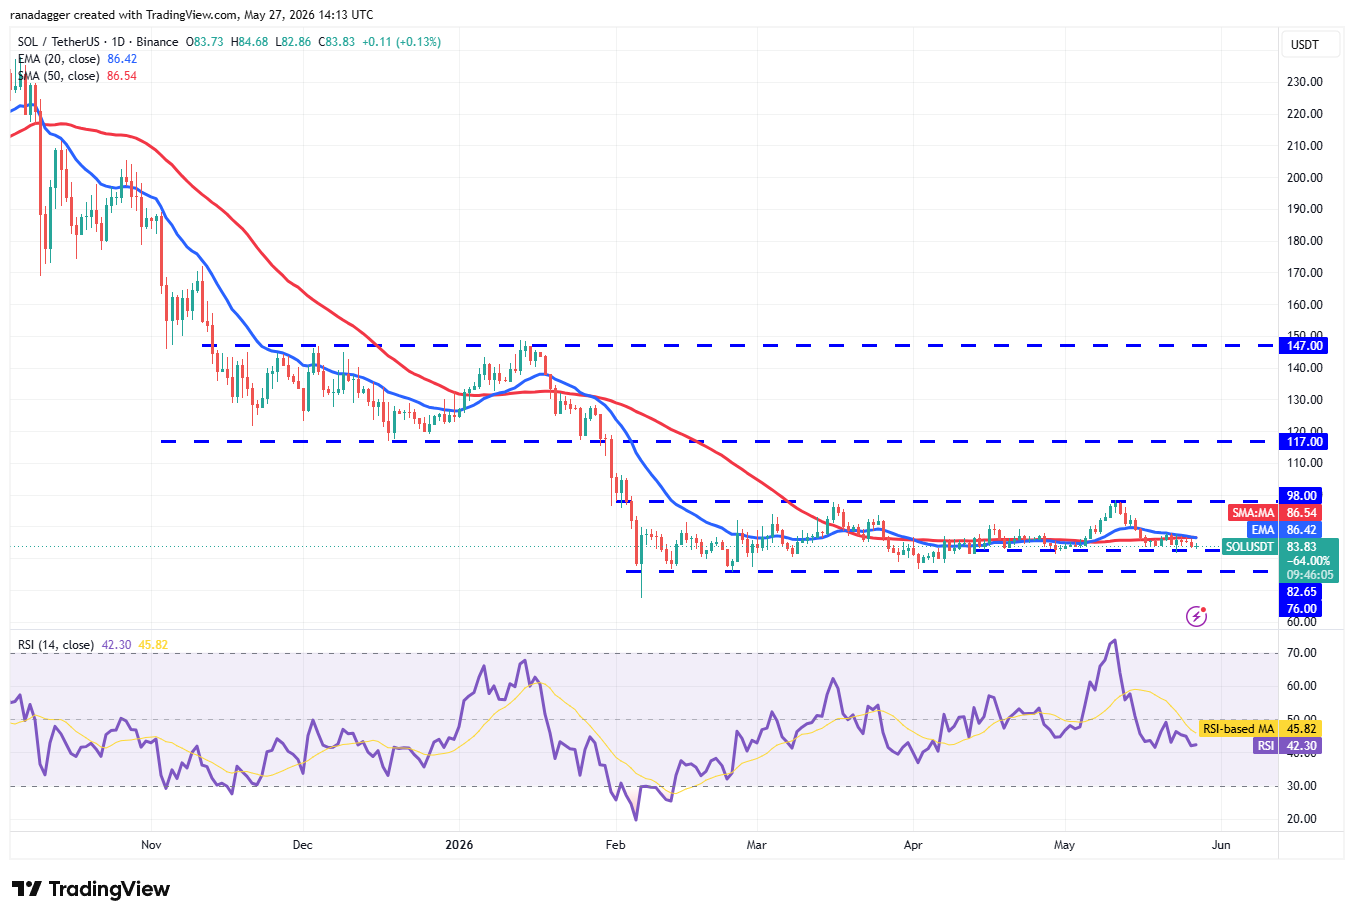
SOL/USDT daily chart. Source: Cointelegraph/TradingView
The 20-day EMA has begun curving downward, and the Relative Strength Index sits in negative territory, giving sellers a slight advantage. A break below $82.65 could trigger a sharp drop toward the $76 support level.
Alternatively, if SOL bounces strongly off $82.65 and clears the 20-day EMA, it would suggest the pair may continue consolidating within the $76–$98 range for some time.
Dogecoin forecast
The bulls’ failure to push Dogecoin (DOGE) past the 20-day EMA ($0.10) reflects persistent negative market sentiment.
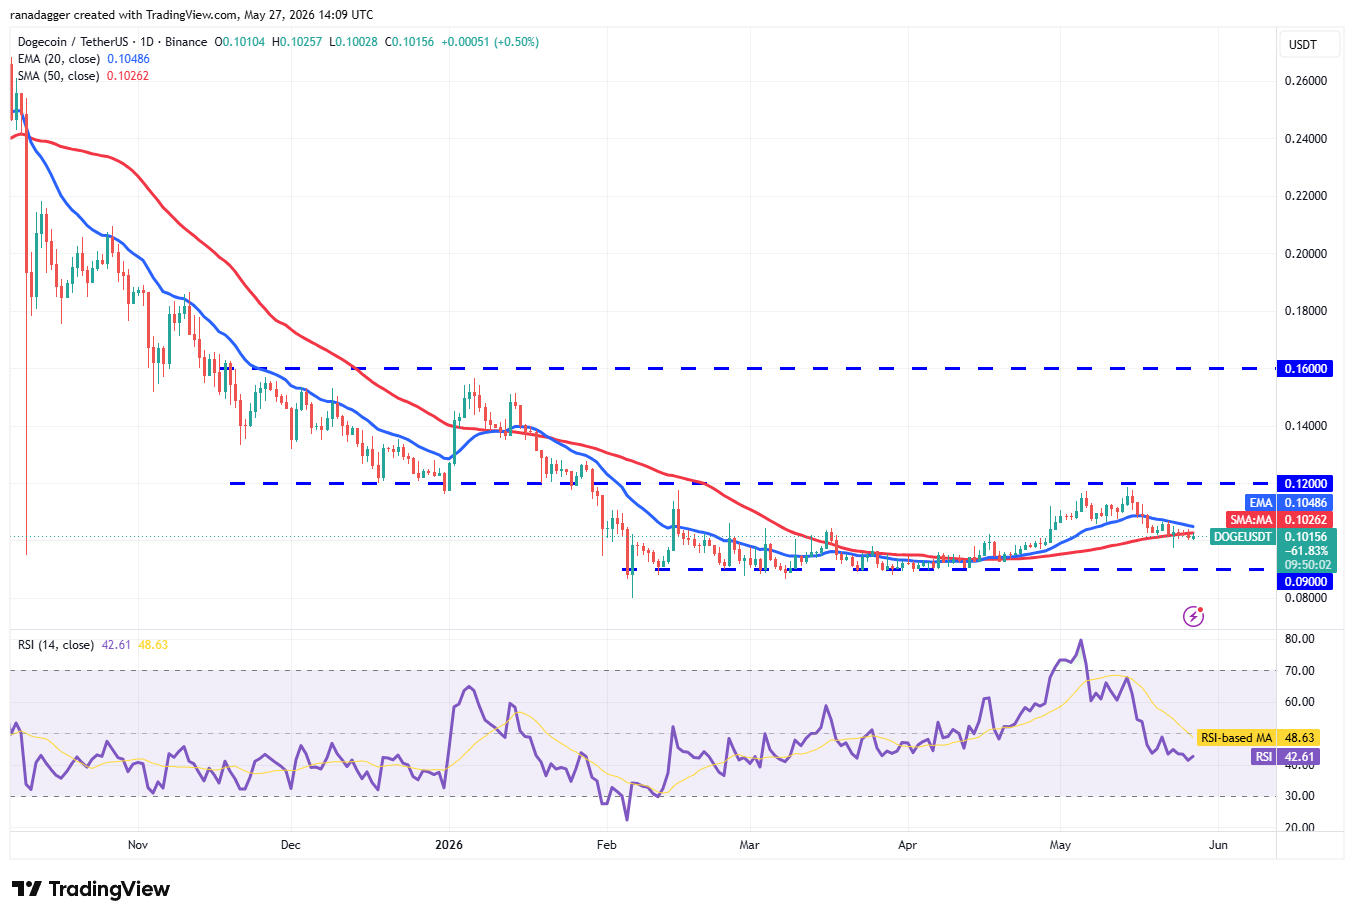
DOGE/USDT daily chart. Source: Cointelegraph/TradingView
Further selling pressure is expected if the price remains below the 20-day EMA. The next key support lies at $0.09; a breach there could open the door to a slide toward $0.08.A reversal in momentum would require DOGE to reclaim the 20-day EMA. Such a move could spark a recovery toward the 50-day SMA ($0.11) and potentially higher.
DOGE/USDT daily chart. Source: Cointelegraph/TradingView
Sellers are trying to push the DOGE price down past $0.10, potentially setting up a revisit of the $0.09 support zone. Buyers are anticipated to put up a strong defense at $0.09, since dropping below that level could send the DOGE/USDT pair tumbling to $0.08.
On the other hand, if the price climbs and closes above the 20-day EMA, it signals the pair might continue trading within the $0.09–$0.12 range for several more days. For buyers to kick off a fresh rally targeting $0.14 and eventually $0.16, they need to push the price above $0.12.
Hyperliquid price prediction
Hyperliquid (HYPE) retreated from $64.93 on Monday, as short-term traders cashed in their gains.
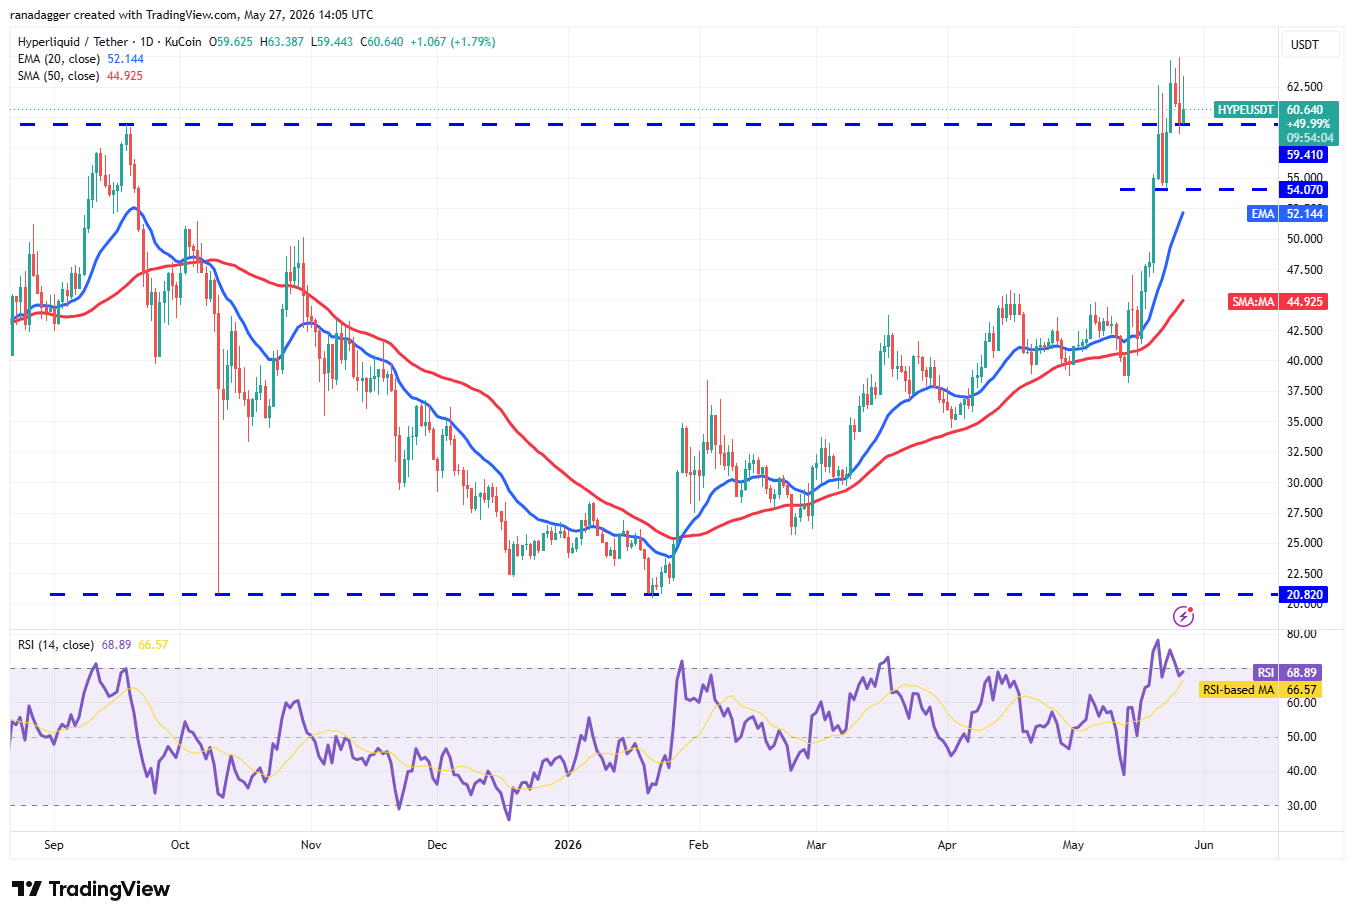
HYPE/USDT daily chart. Source: Cointelegraph/TradingView
Bulls are trying to halt the pullback right at the breakout level of $59.41. A successful hold there would mean bulls have turned that level into support, boosting the chances of a push above $64.93. From there, the HYPE/USDT pair could rally toward $77.
However, if the HYPE price drops below $59.41, the correction could worsen, pulling the price down to the 20-day EMA ($52.14). Buyers are expected to fiercely protect this level, since sliding below it would signal the beginning of a deeper pullback toward the 50-day SMA ($44.92).
Related: Three key XRP metrics suggest ‘explosive price expansion’ is next
Zcash price prediction
Zcash (ZEC) pulled back from the $690 mark on Monday, as short-term traders locked in profits.
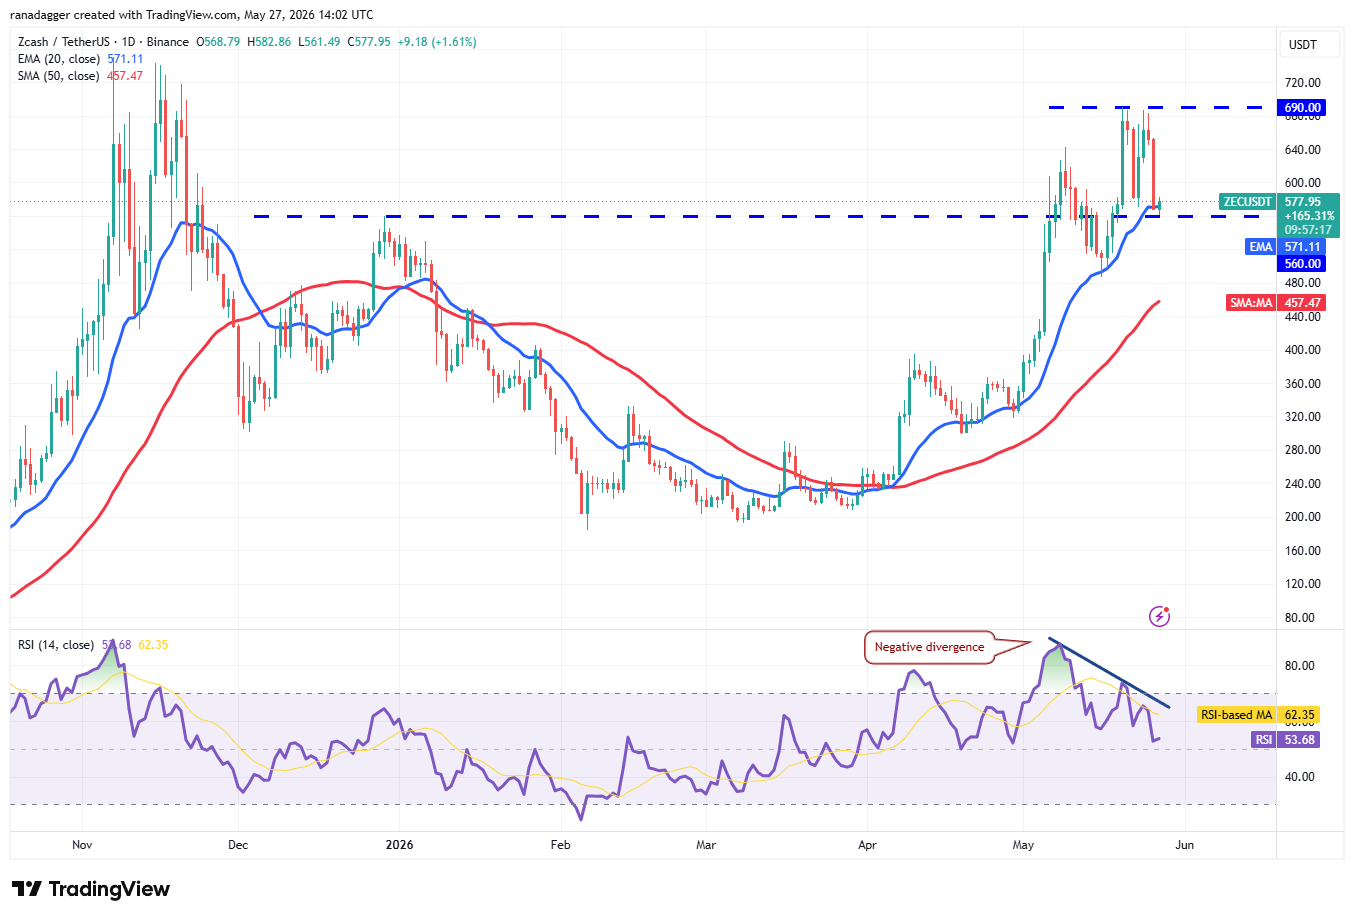
ZEC/USDT daily chart. Source: Cointelegraph/TradingView
Sellers are working to keep the price below the 20-day EMA ($571), which could pave the way for a sharper decline. If they succeed, the ZEC price may drop to $486 and then toward the 50-day SMA ($457).
The 20-day EMA is flattening out, and the RSI is sliding toward the midpoint, suggesting bulls are losing steam. To regain control, buyers need to push the ZEC/USDT pair above $690.
Cardano price prediction
Cardano (ADA) continues to trade below its moving averages, giving bears the upper hand.
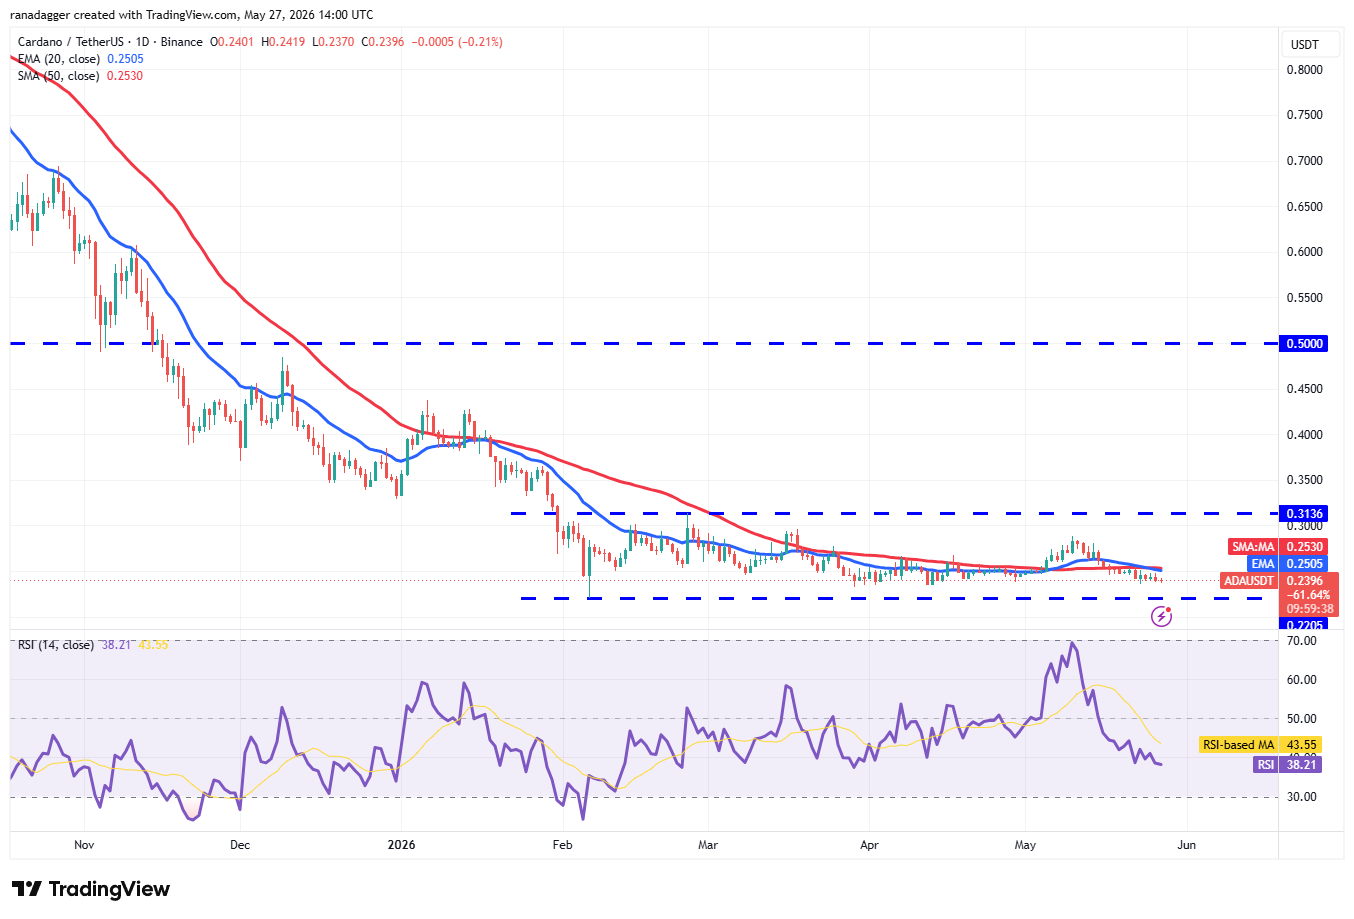
ADA/USDT daily chart. Source: Cointelegraph/TradingView
Sellers will aim to drag ADA down to the $0.22 support. Any bullish rebound attempt is likely to meet stiff selling pressure at the 20-day EMA ($0.25). A sharp rejection from there would raise the odds of a breakdown below $0.22.
Looking higher, a decisive close above the moving averages would indicate the ADA/USDT pair may keep bouncing between $0.22 and $0.31 for a while longer. The next major directional move should kick off once the price closes either above $0.31 or below $0.22.
Monero price prediction
Monero (XMR) has been moving within an ascending channel, indicating buyers have the advantage.
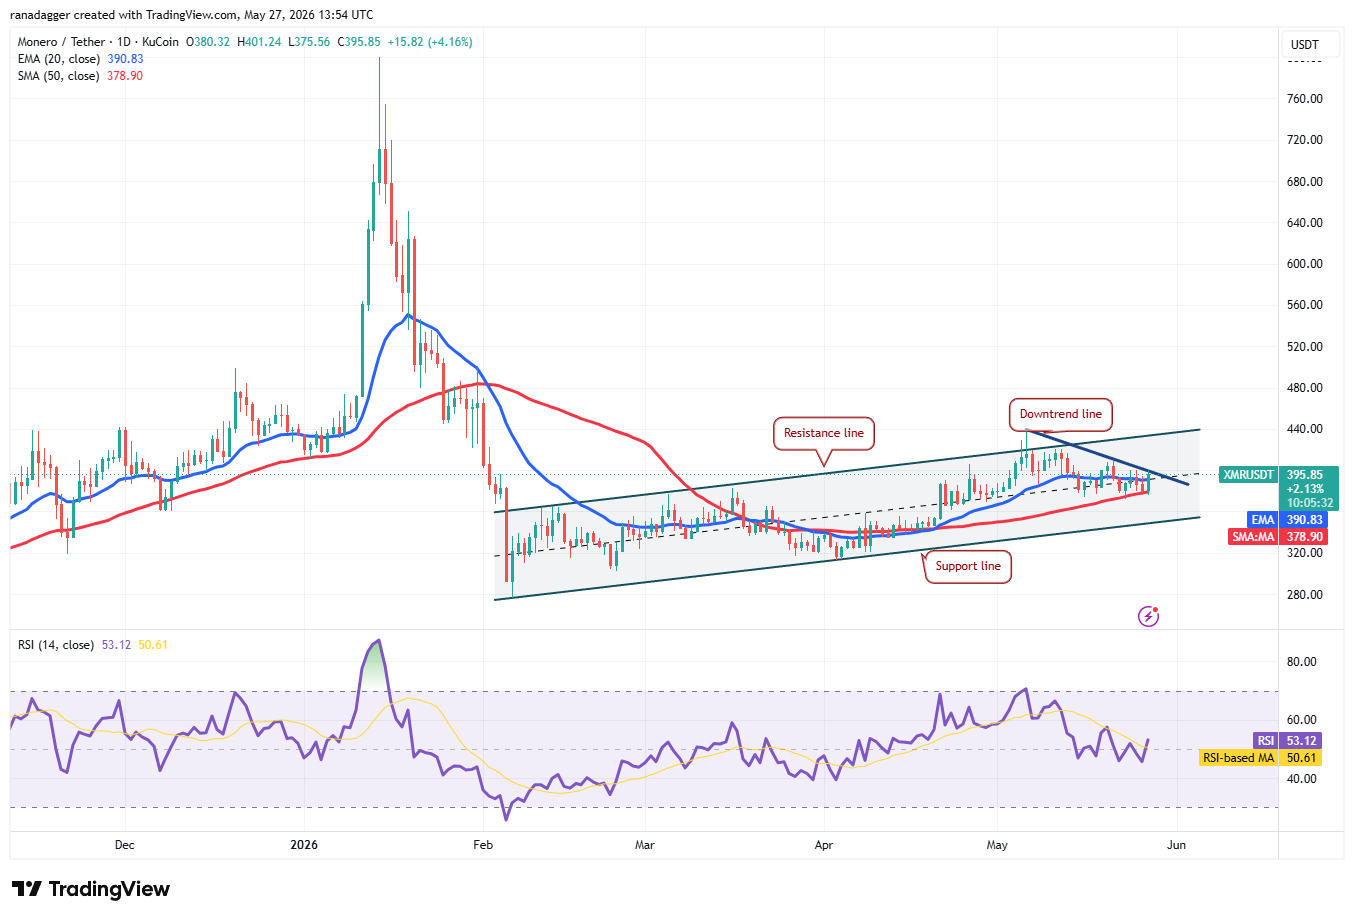
XMR/USDT daily chart. Source: Cointelegraph/TradingView
The XMR price has bounced off the 50-day SMA ($378), suggesting dip-buying interest. Resistance sits at the downtrend line, but a break above it could send the XMR/USDT pair up toward the channel’s resistance line. Bullish strength would grow if buyers manage to sustain the price above that resistance.
Conversely, if the price reverses from the downtrend line and falls below the 50-day SMA, it would indicate bears are selling into rallies. The pair could then slide down to the channel’s support line.
