


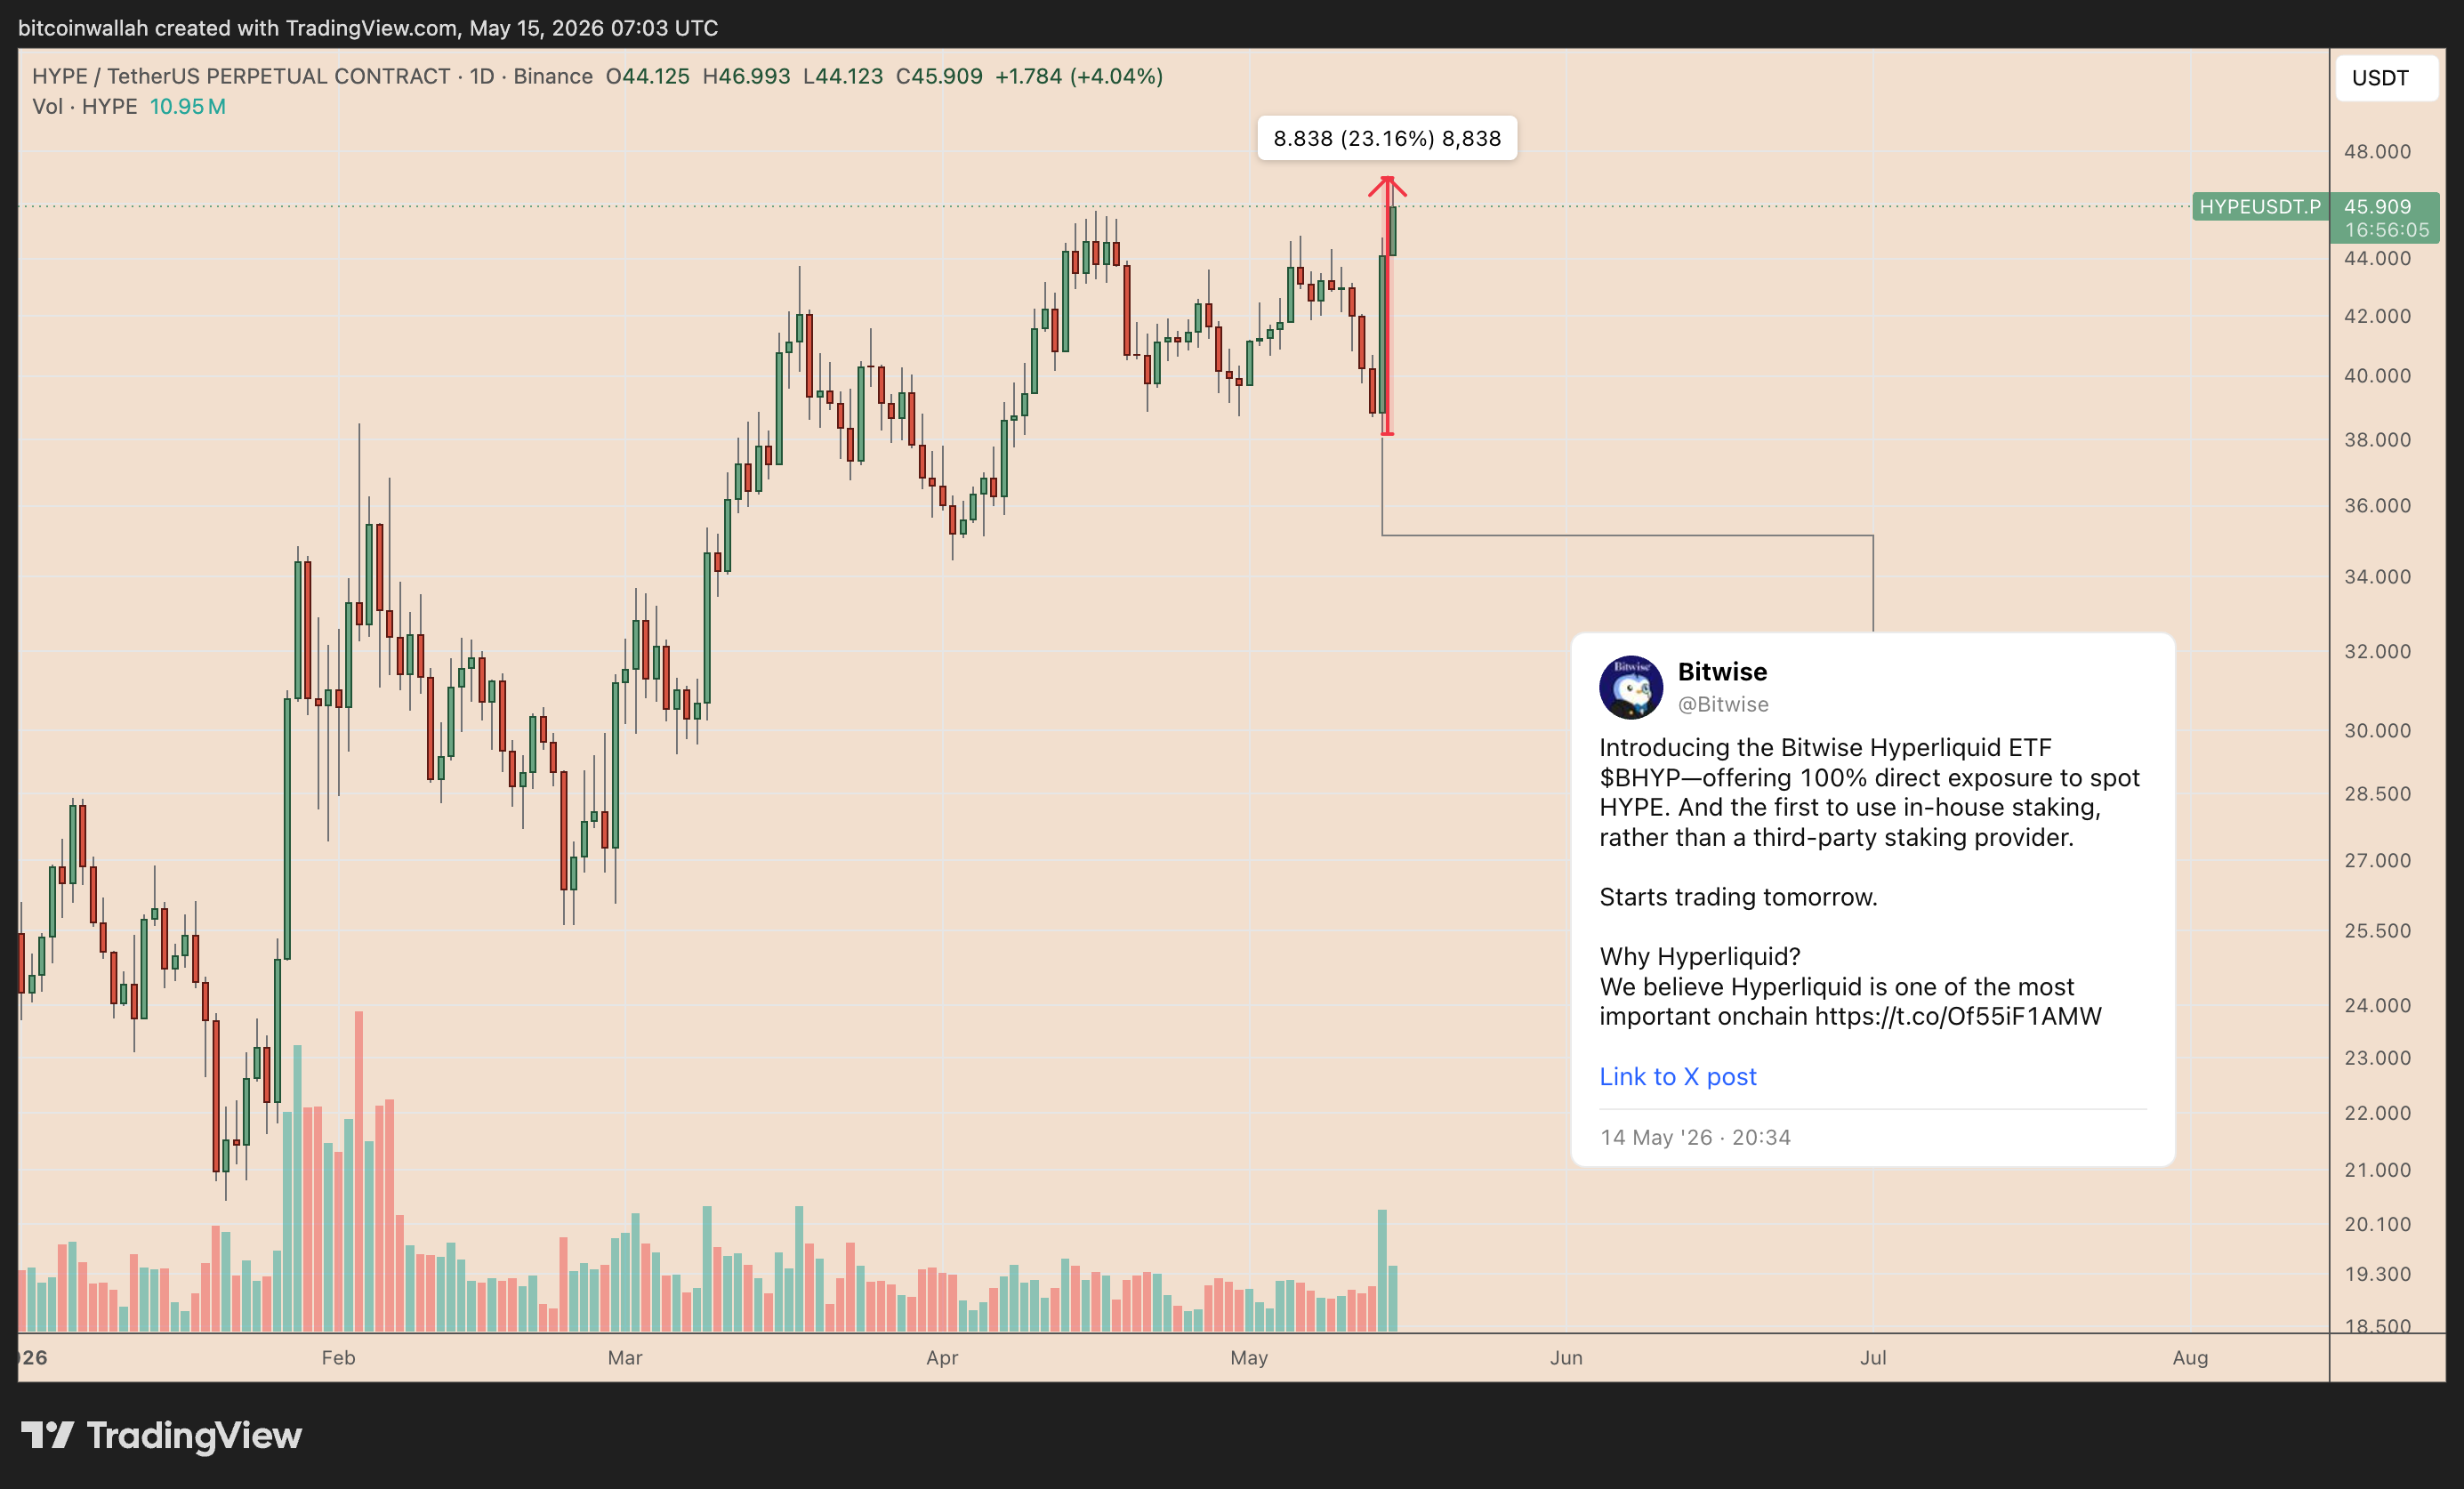
HYPE, the native cryptocurrency of the decentralized exchange Hyperliquid, surged over 23% in the last 24 hours, pushing toward $47 on Friday and reaching its highest point since October 2025.
HYPE/USDT daily chart. Source: TradingView
What’s behind this sudden surge in HYPE, and does the token have enough steam to keep climbing in the days ahead?
Key highlights:
- A wave of US spot HYPE ETF launches this week has reinforced the token’s appeal to institutional investors.
- Coinbase stepping in as Hyperliquid’s USDC treasury deployer is giving HYPE prices an additional lift.
HYPE ETF launches stoke institutional demand
The primary driver behind HYPE’s recent rally seems to be the introduction of US-listed Hyperliquid exchange-traded products.
On Friday, Bitwise rolled out its spot Hyperliquid ETF, listed under the ticker BHYP on the NYSE.
HYPE/USDT daily chart. Source: TradingView
The fund offers investors a regulated way to gain exposure to HYPE and plans to stake a portion of its holdings through Bitwise’s dedicated staking arm. It carries a sponsor fee of 0.34%, with a complete fee waiver for the first month on the initial $500 million in assets.
This launch comes on the heels of 21Shares’ Hyperliquid ETF, THYP, which went live on Nasdaq earlier in the week on Tuesday.
The following day, onchain analytics platform Lookonchain reported that wallets associated with venture capital firm a16z had acquired nearly $67.5 million worth of HYPE tokens.
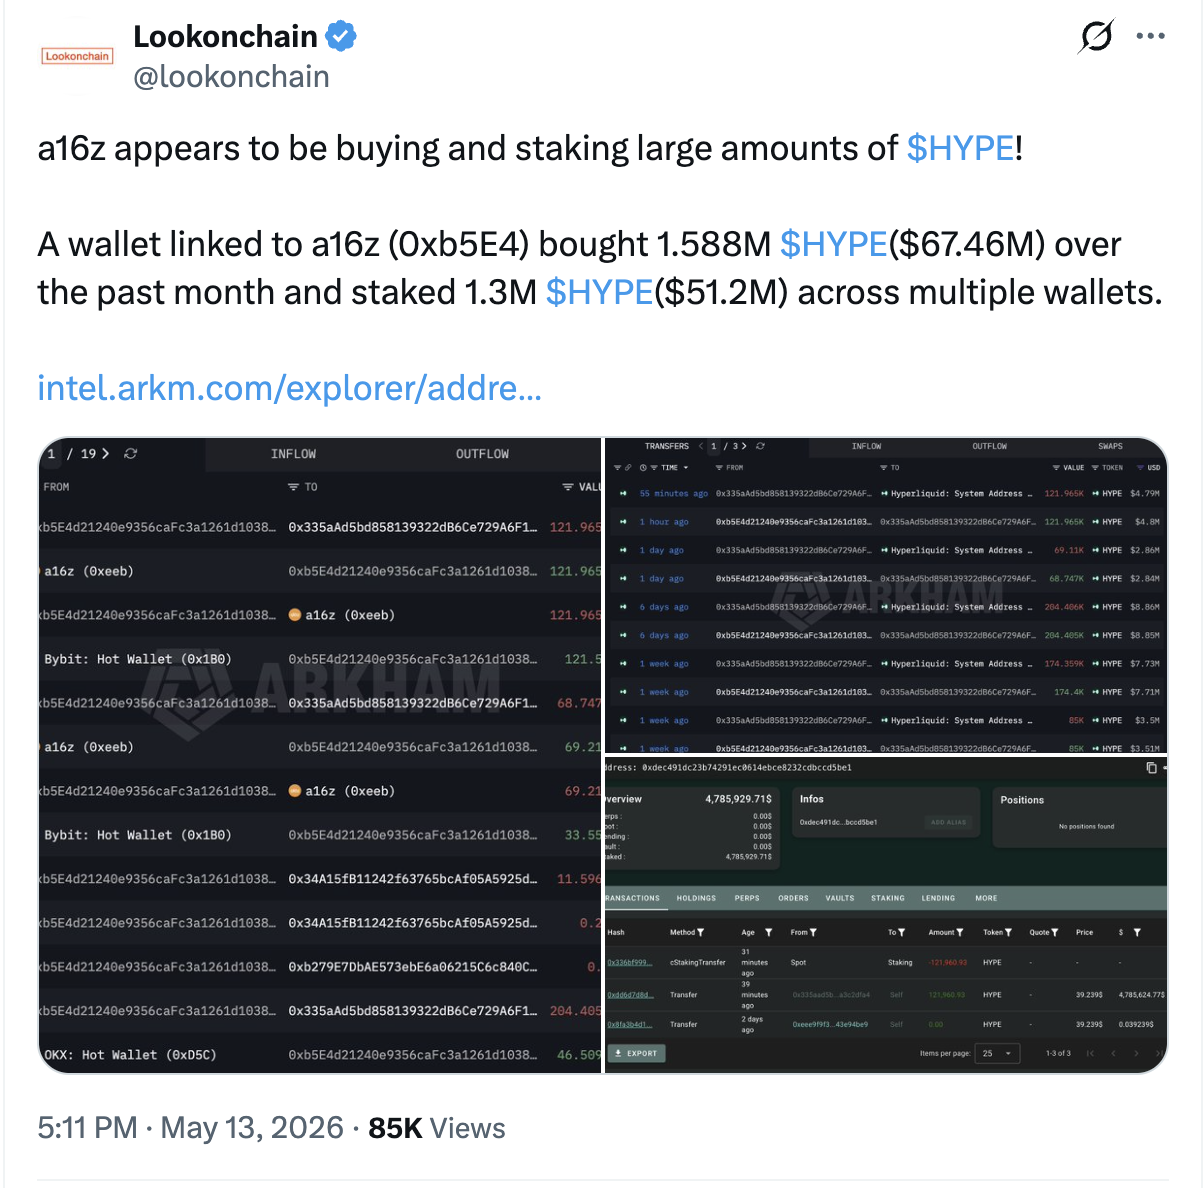
Source: X
These purchases reportedly occurred in the month leading up to the ETF launches, further signaling rising institutional appetite for Hyperliquid.
Whether HYPE can maintain its upward trajectory through May will likely hinge on whether the new ETFs draw substantial inflows rather than just fueling short-term launch-week excitement.
As of Friday, the combined assets under management stood at $3.17 million, according to SoSoValue data.
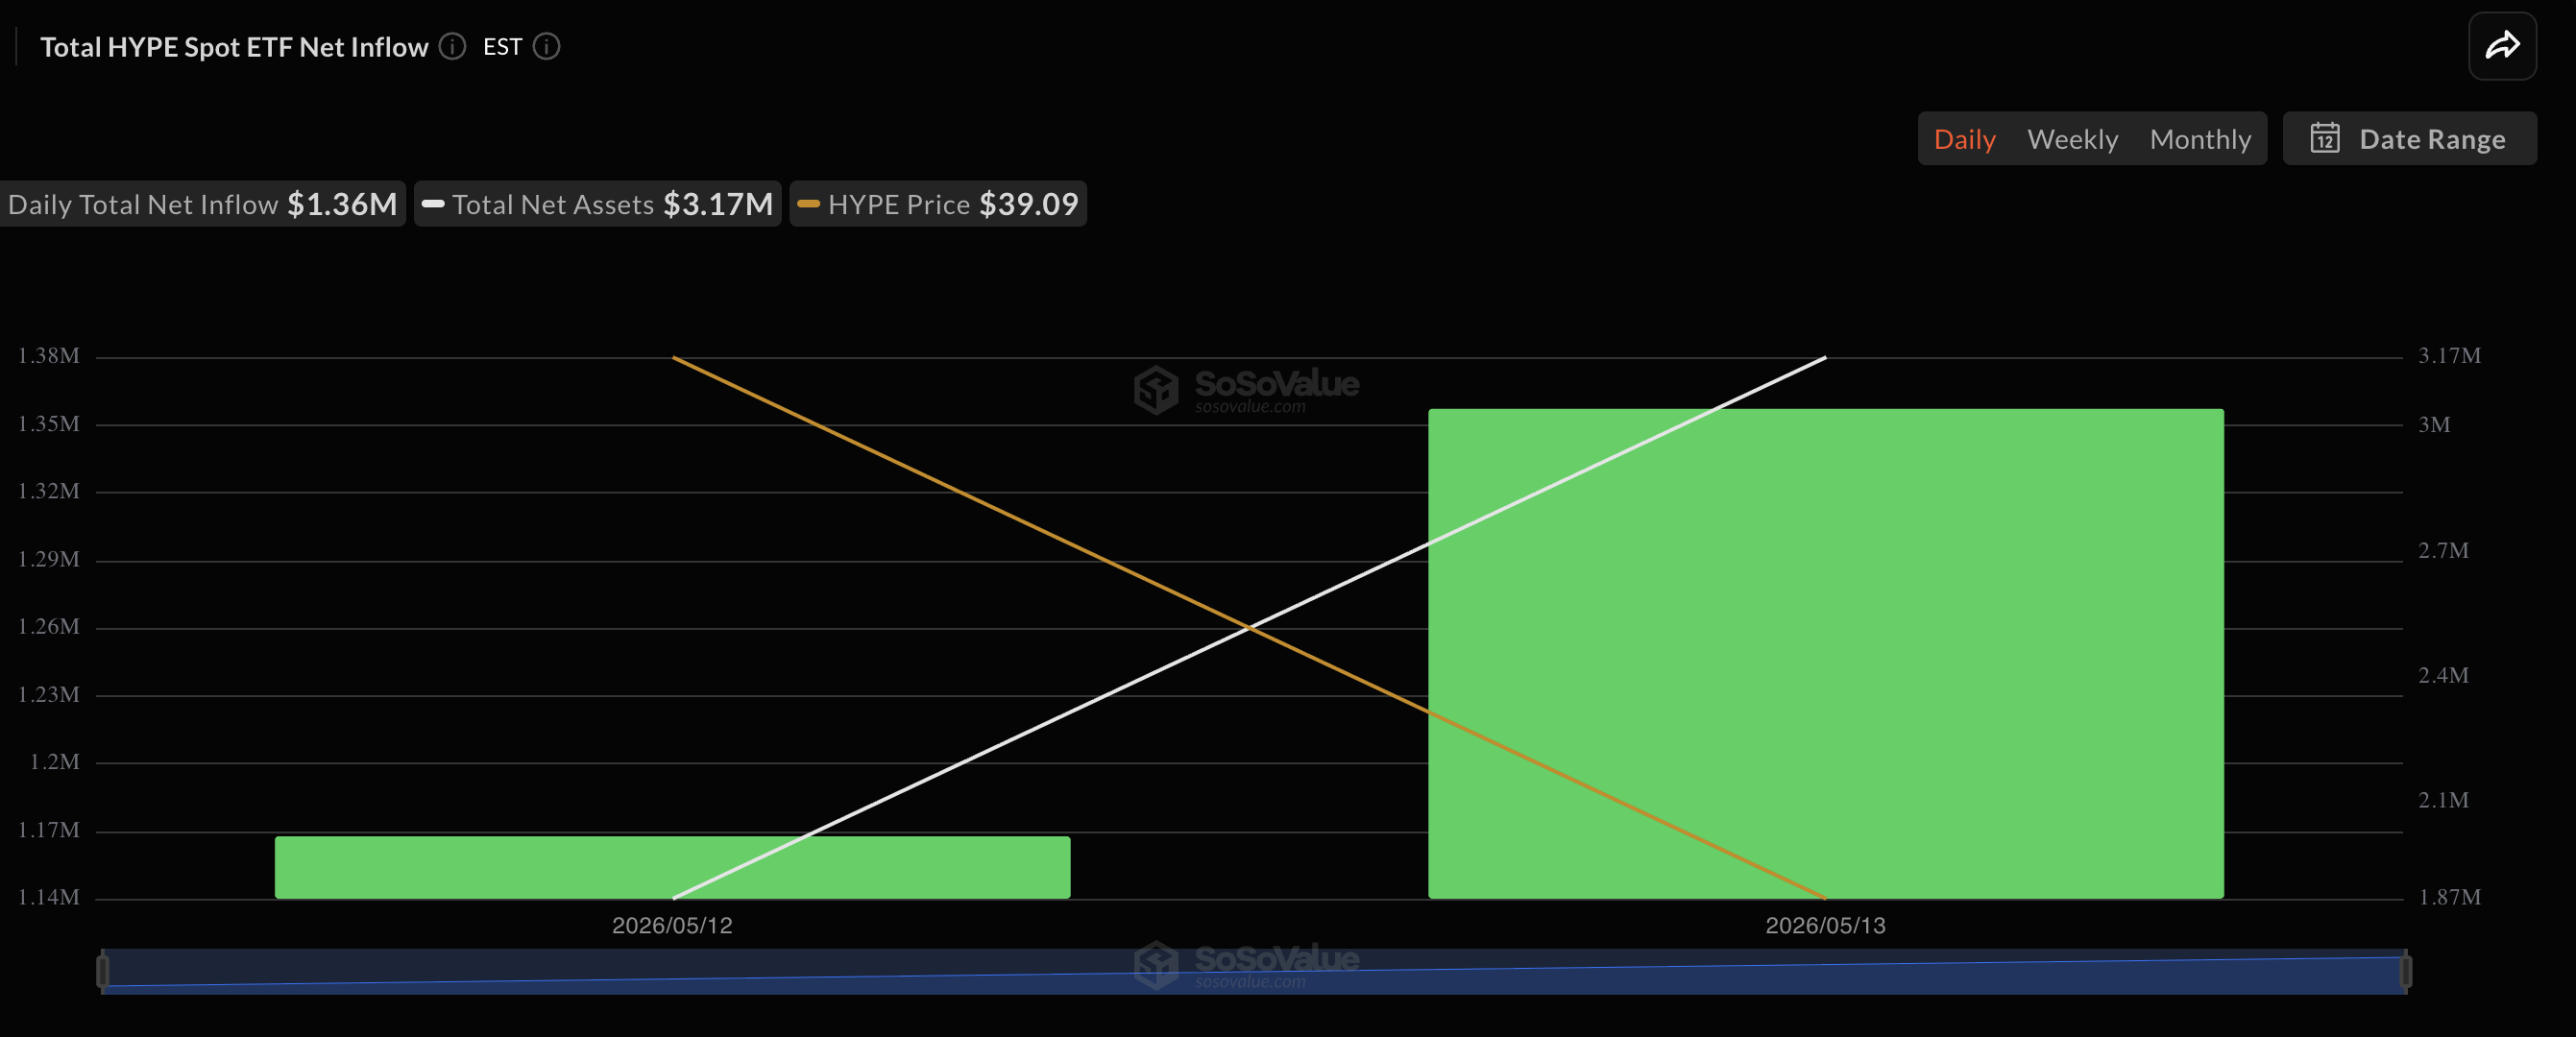
US spot HYPE ETFs net flows. Source: SoSoValue
Coinbase and Circle partnership provides structural boost for HYPE
HYPE’s rally received another boost after Coinbase revealed on Thursday that it had taken on the role of official treasury deployer for USDC on Hyperliquid.
This arrangement reinforces USDC’s position as the primary collateral and quote asset throughout Hyperliquid’s onchain trading markets.
The stablecoin already represents approximately $5 billion in supply on Hyperliquid, making it the leading stablecoin within the ecosystem, per DefiLlama.
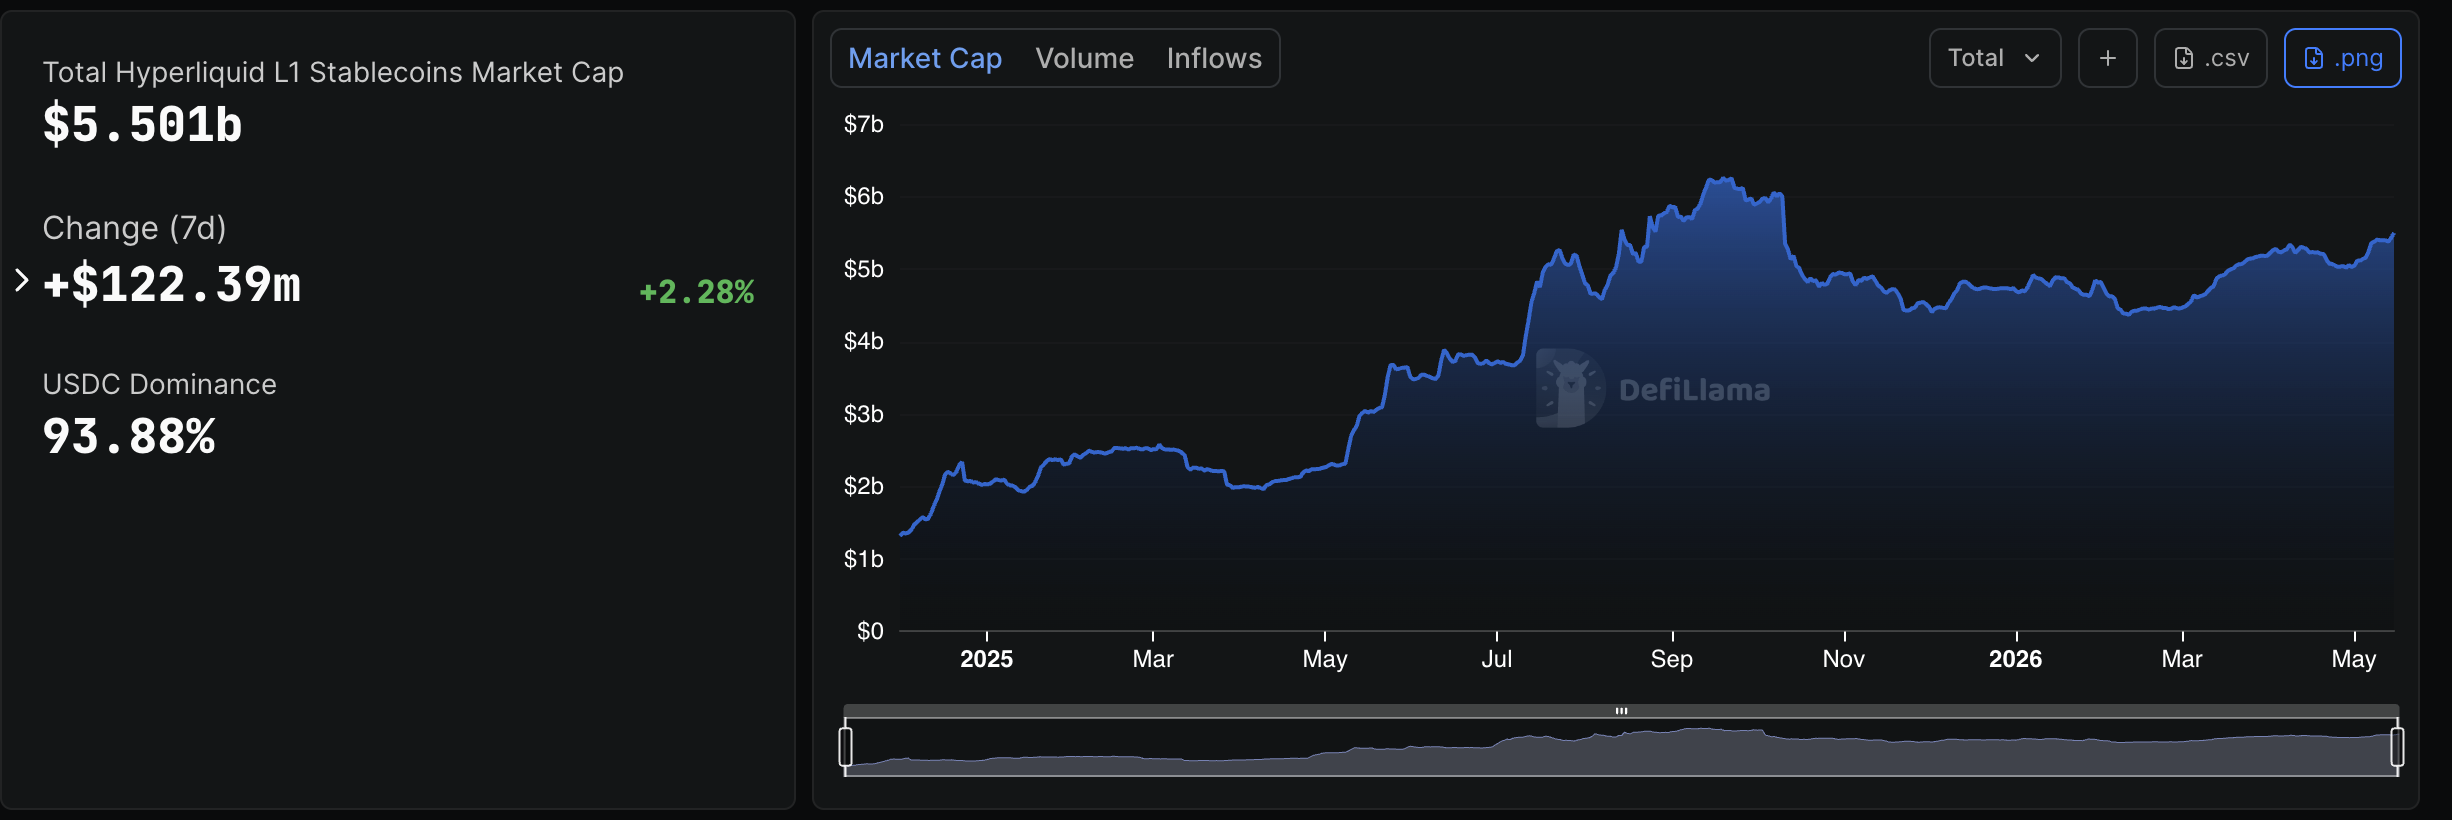
Stablecoin market cap on Hyperliquid. Source: DefiLlama
Under the enhanced AQAv2 framework, Coinbase is expected to pass along the lion’s share of reserve-yield revenue generated from USDC deployed on Hyperliquid back to the protocol.
Circle will also act as the technical deployer for USDC on Hyperliquid and has pledged to stake 500,000 HYPE tokens.
“It’s an acknowledgment that Hyperliquid is too dominant in perps to displace, so it makes more sense to align and capture distribution,” analyst Aylo noted in a Thursday post, adding:
“We should see an increase of ~$140M+ in annualised revenue which will be used to buyback HYPE.”
CLARITY Act advancement offers regulatory support
HYPE’s rally also coincided with encouraging developments in US crypto regulation.
On May 14, the Senate Banking Committee moved the CLARITY Act forward in a 15–9 vote, marking a significant milestone for legislation that seeks to clarify when digital assets should be classified as securities or commodities.
The news lifted sentiment across the broader crypto market, triggering intraday rallies in Bitcoin, Ethereum, XRP, and other major cryptocurrencies.
However, the CLARITY Act has not yet become law. The bill now moves to the full Senate, where it will likely require broader bipartisan backing to clear procedural obstacles.
Should it pass the Senate, lawmakers would still need to reconcile it with the House version before delivering a final bill to President Donald Trump for his signature.
HYPE rising wedge pattern signals risk of 30% pullback
HYPE’s current upward momentum is unfolding within what appears to be a rising wedge formation, identified by the price moving between two converging, upward-sloping trend lines.
In technical analysis, this pattern typically resolves when the price breaks below the lower trend line and declines by a distance equal to the structure’s maximum height.
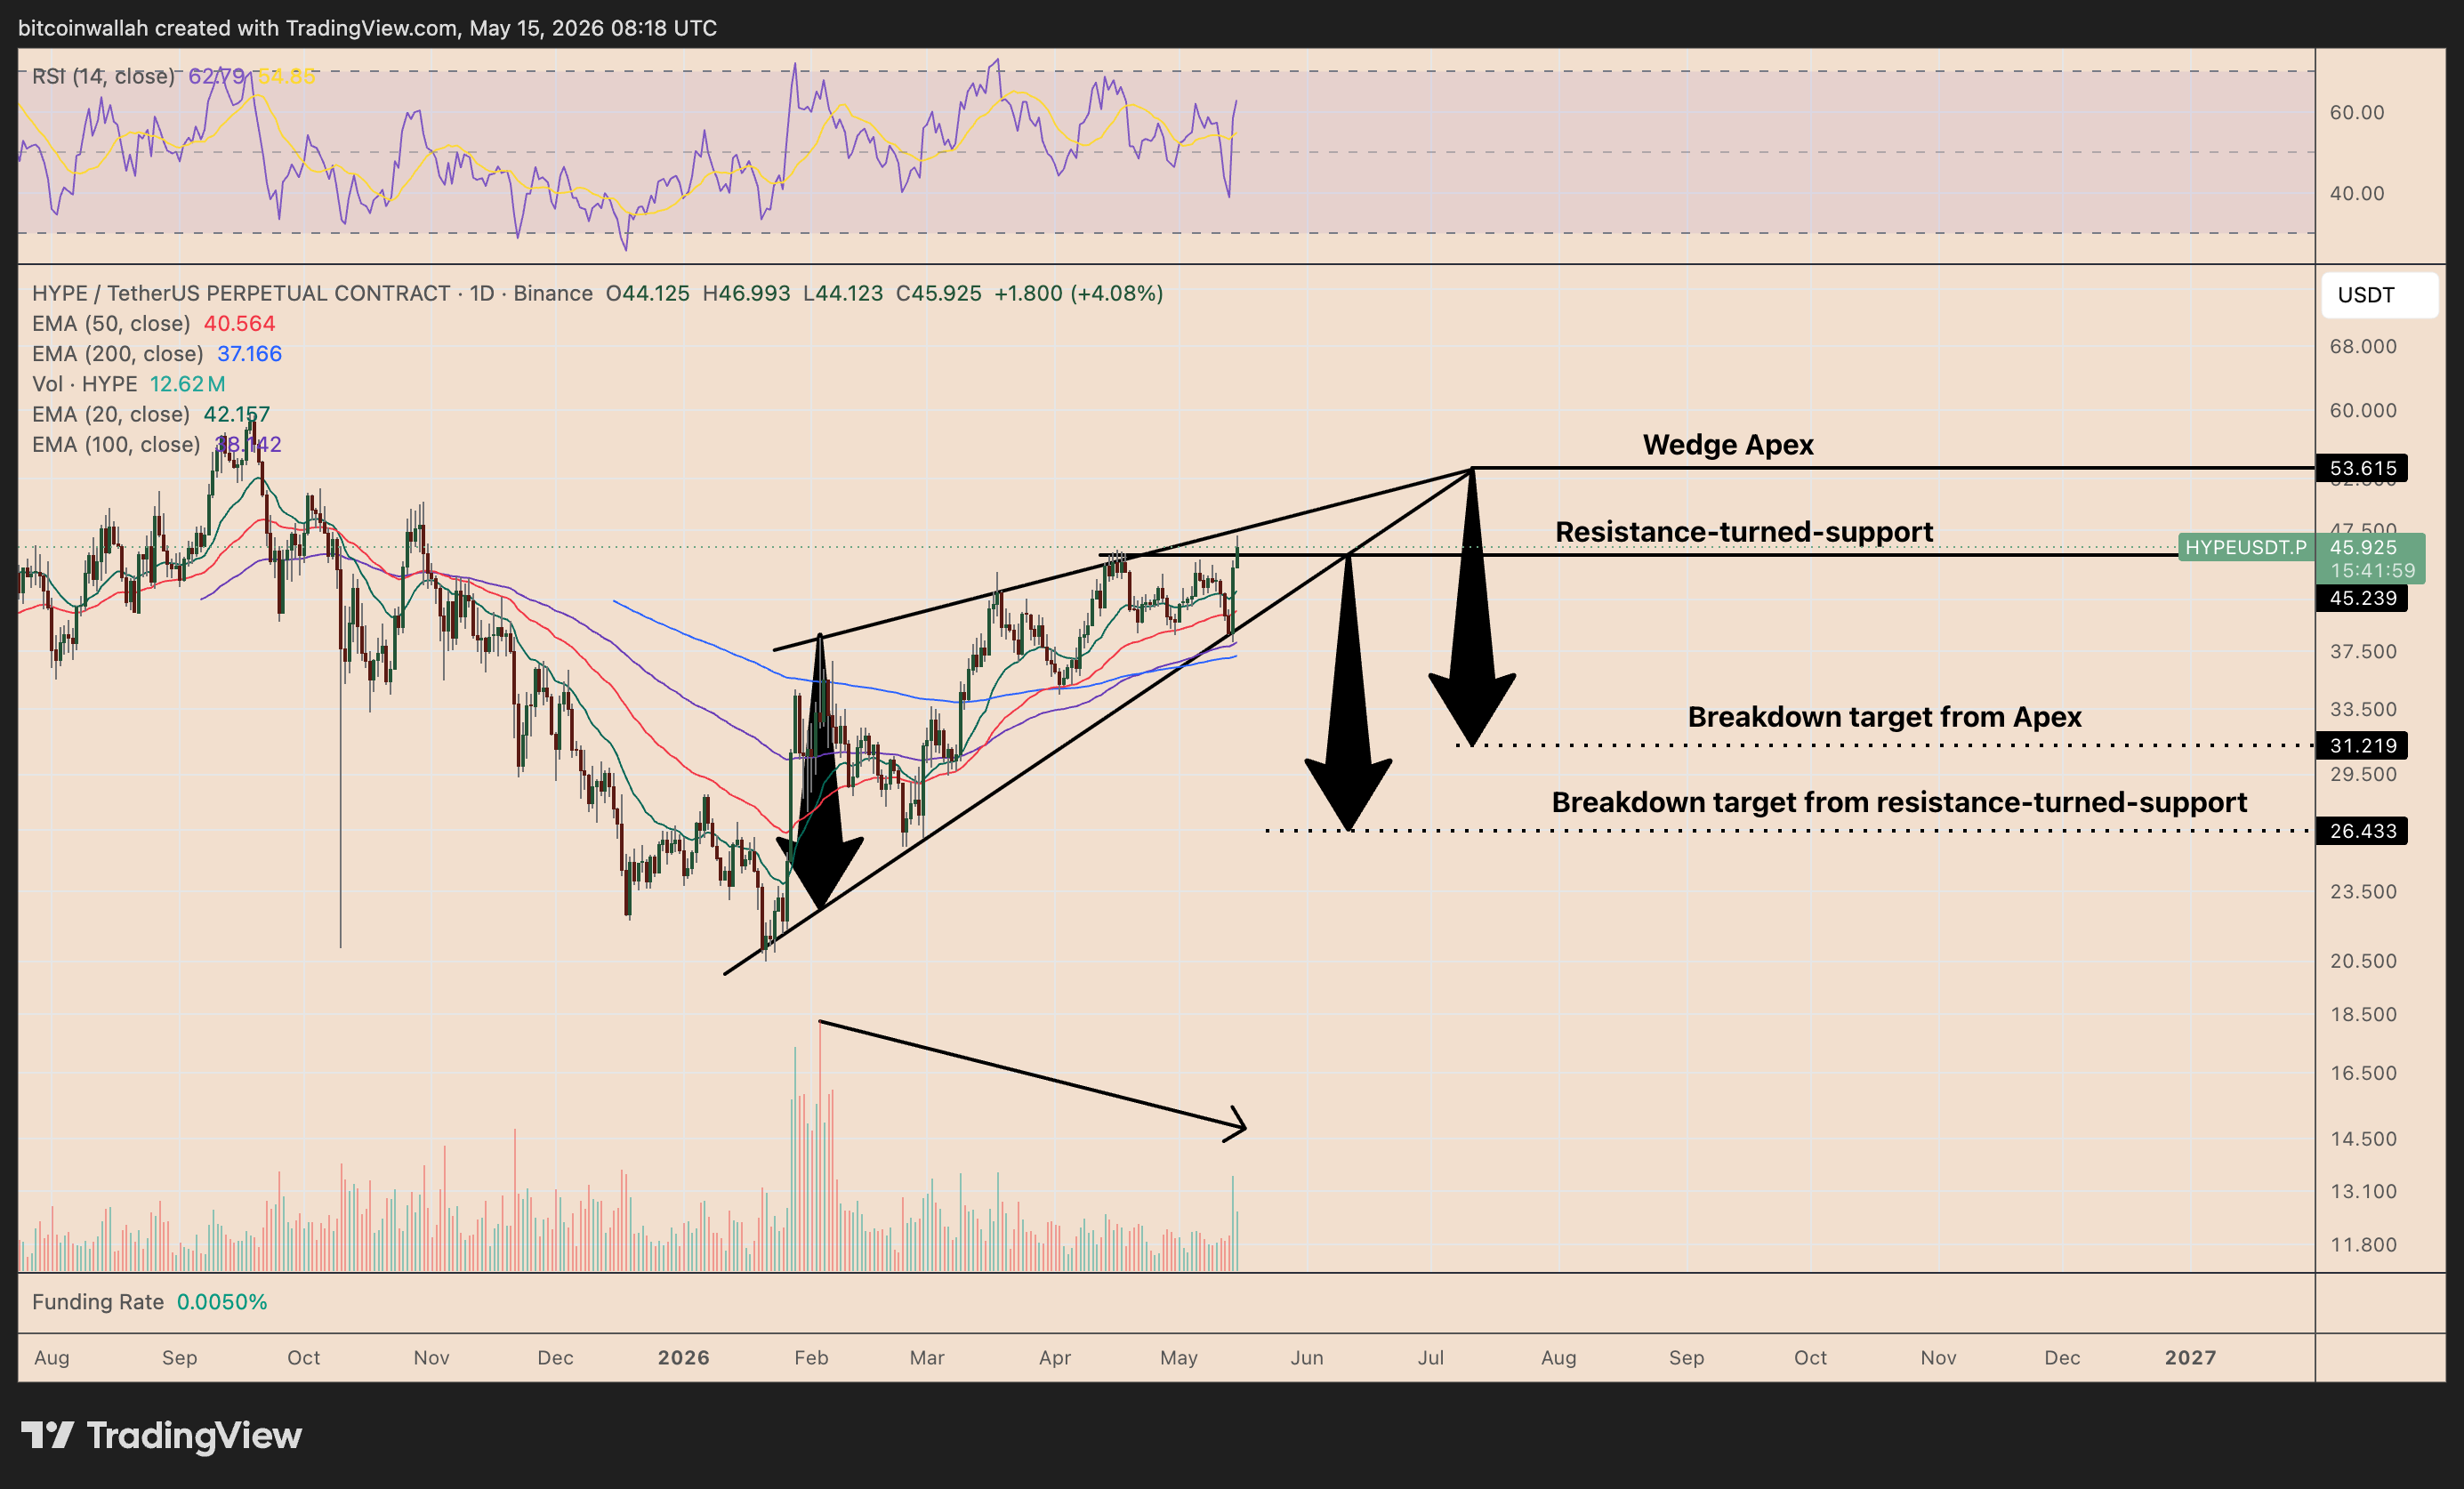
HYPE/USDT daily chart. Source: TradingView
Applying this measurement to the HYPE chart sets a downside target in the $26.5–$31.20 range, depending on where the breakdown occurs, as illustrated above. That translates to a potential 30%–45% correction by June or July.
On the flip side, a convincing breakout above the rising wedge’s upper boundary could negate the bearish scenario entirely, sending HYPE’s price toward the $59–$60 zone, in line with the 1.0 Fibonacci retracement level shown below.
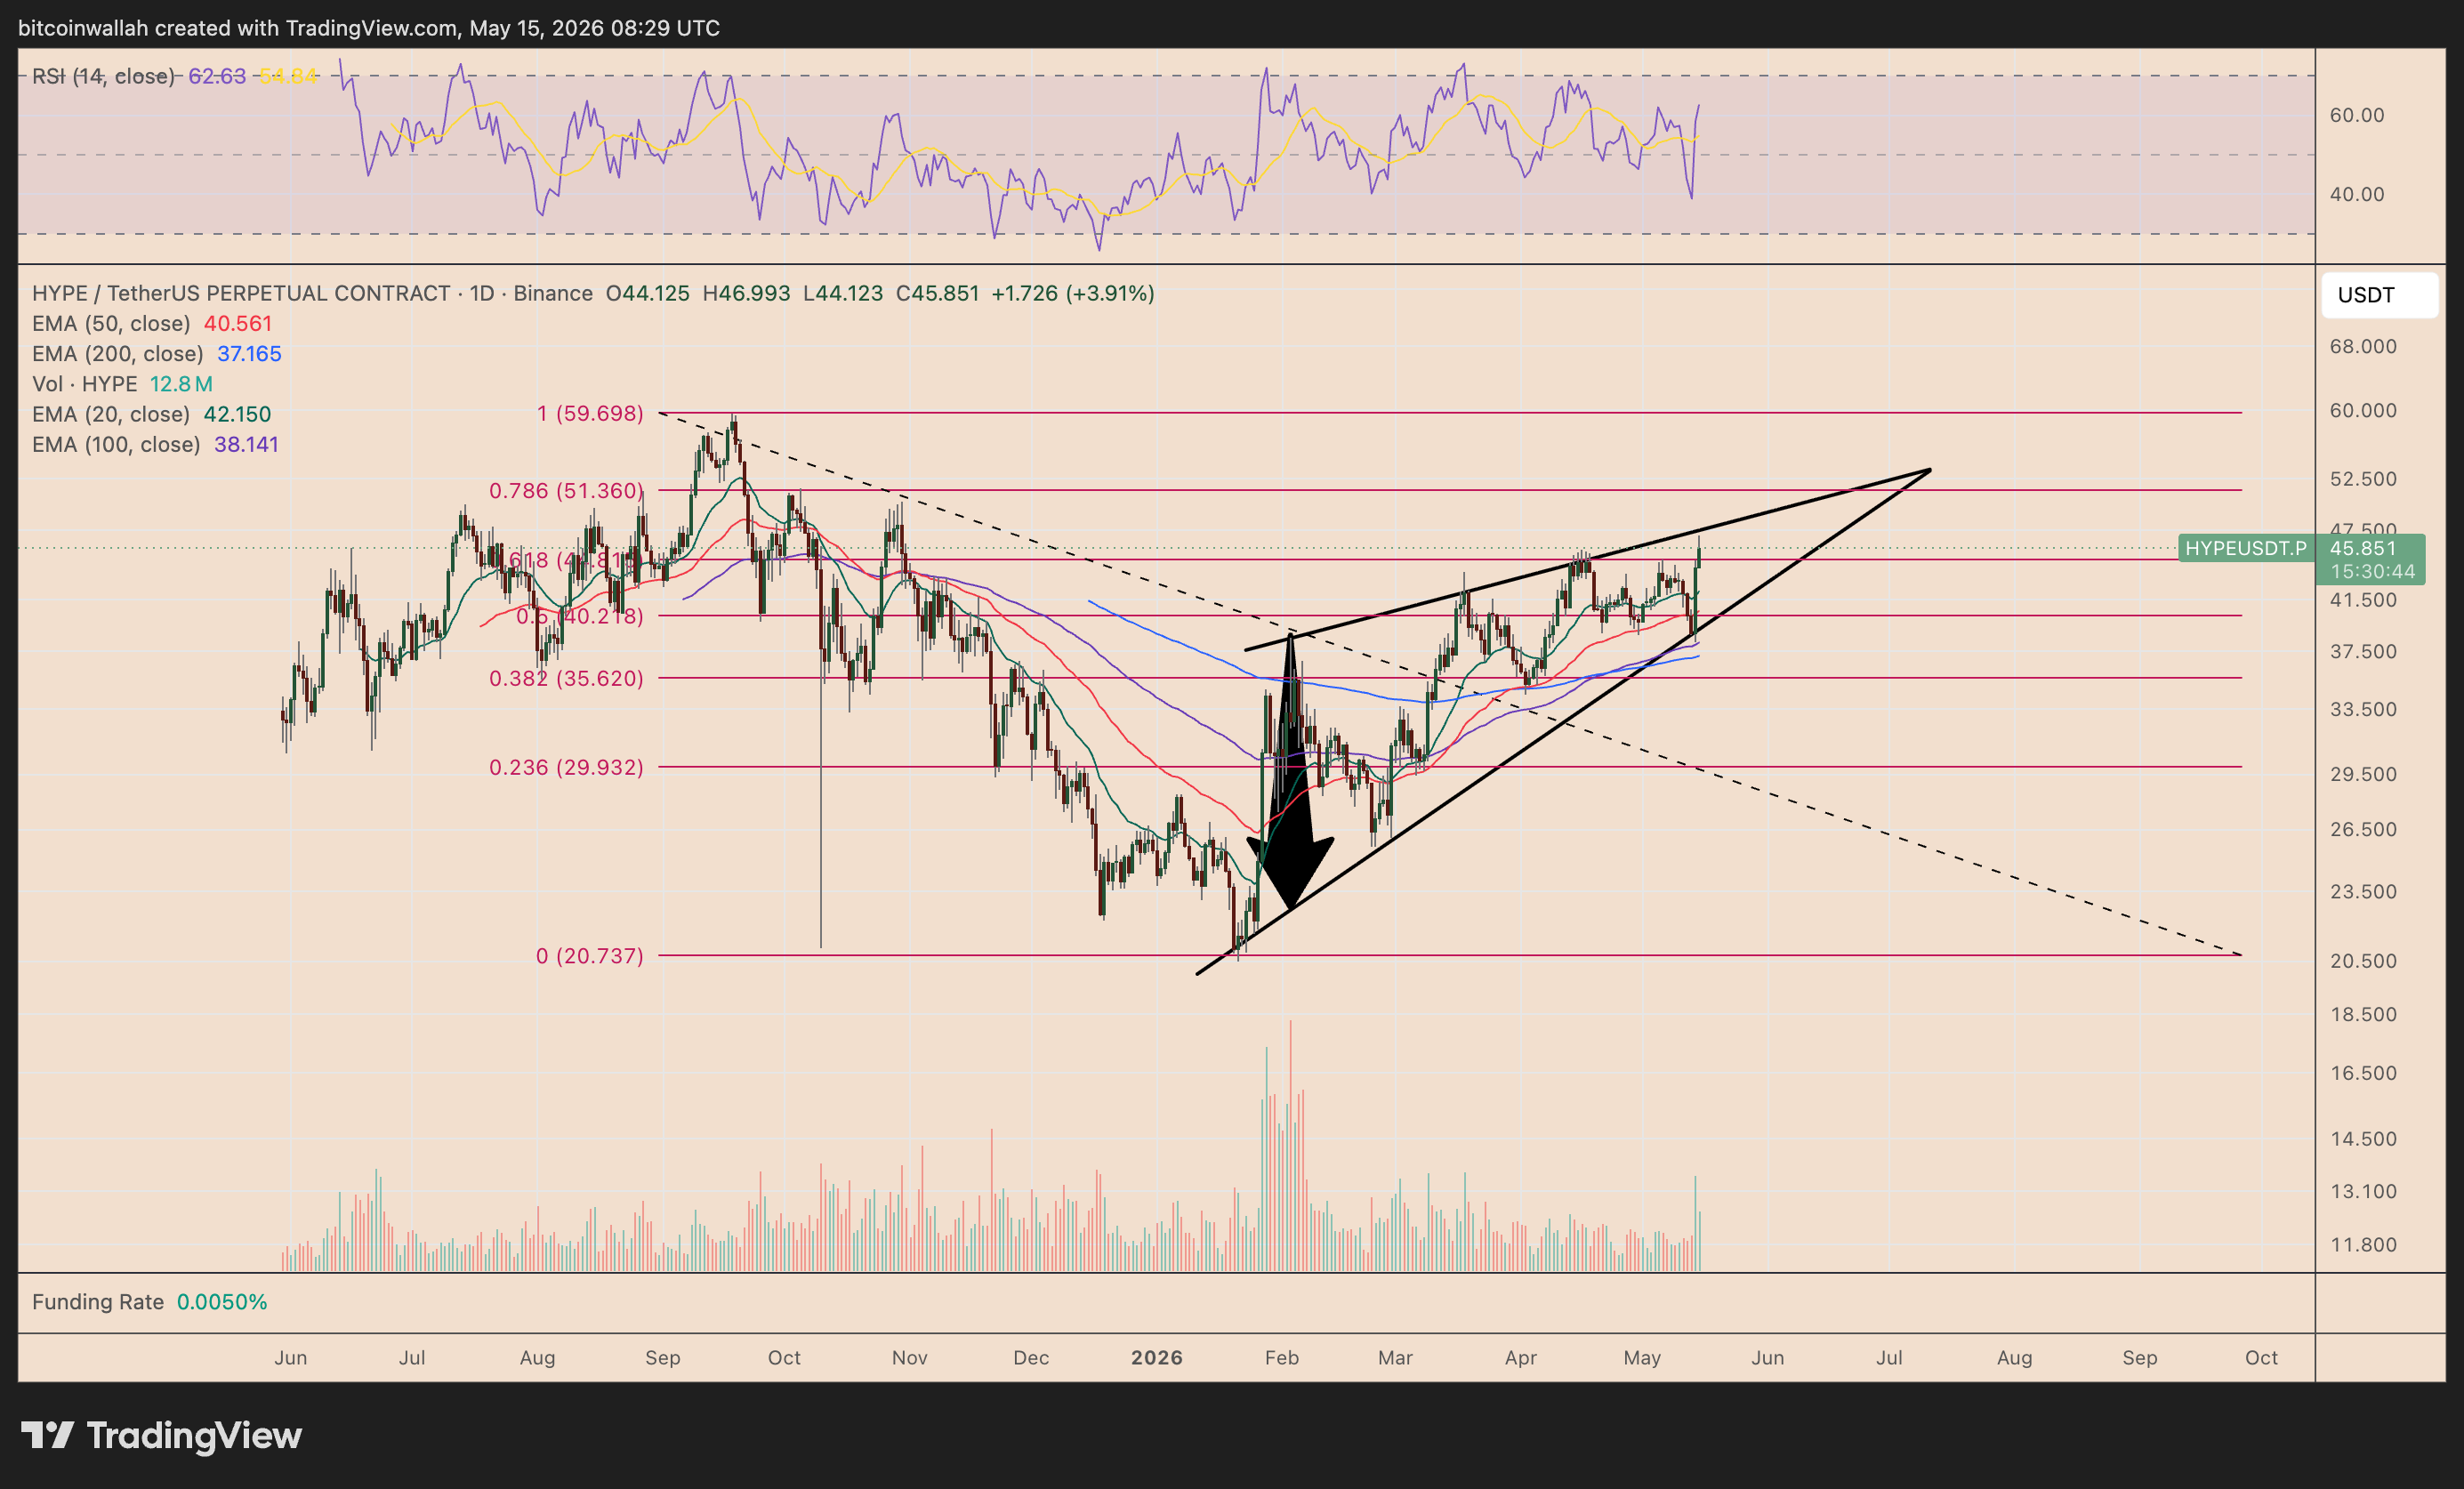
HYPE/USDT daily chart. Source: TradingView
HYPE’s daily relative strength index (RSI) also lends support to the near-term bullish outlook. The indicator remains below the overbought threshold of 70, suggesting the price still has room to continue its upward move.