



# Self-Service GPU Observability in Multi-Tenant Kubernetes Clusters
### How one engineering team solved the most expensive blind spot in their infrastructure
—
It started with a simple question during a cost review meeting. A slide displaying the month’s GPU expenditure — the single largest line item in the infrastructure budget — prompted someone to ask, “Are we actually using these?” Nobody could answer. The most expensive hardware in the organization was also the least visible.
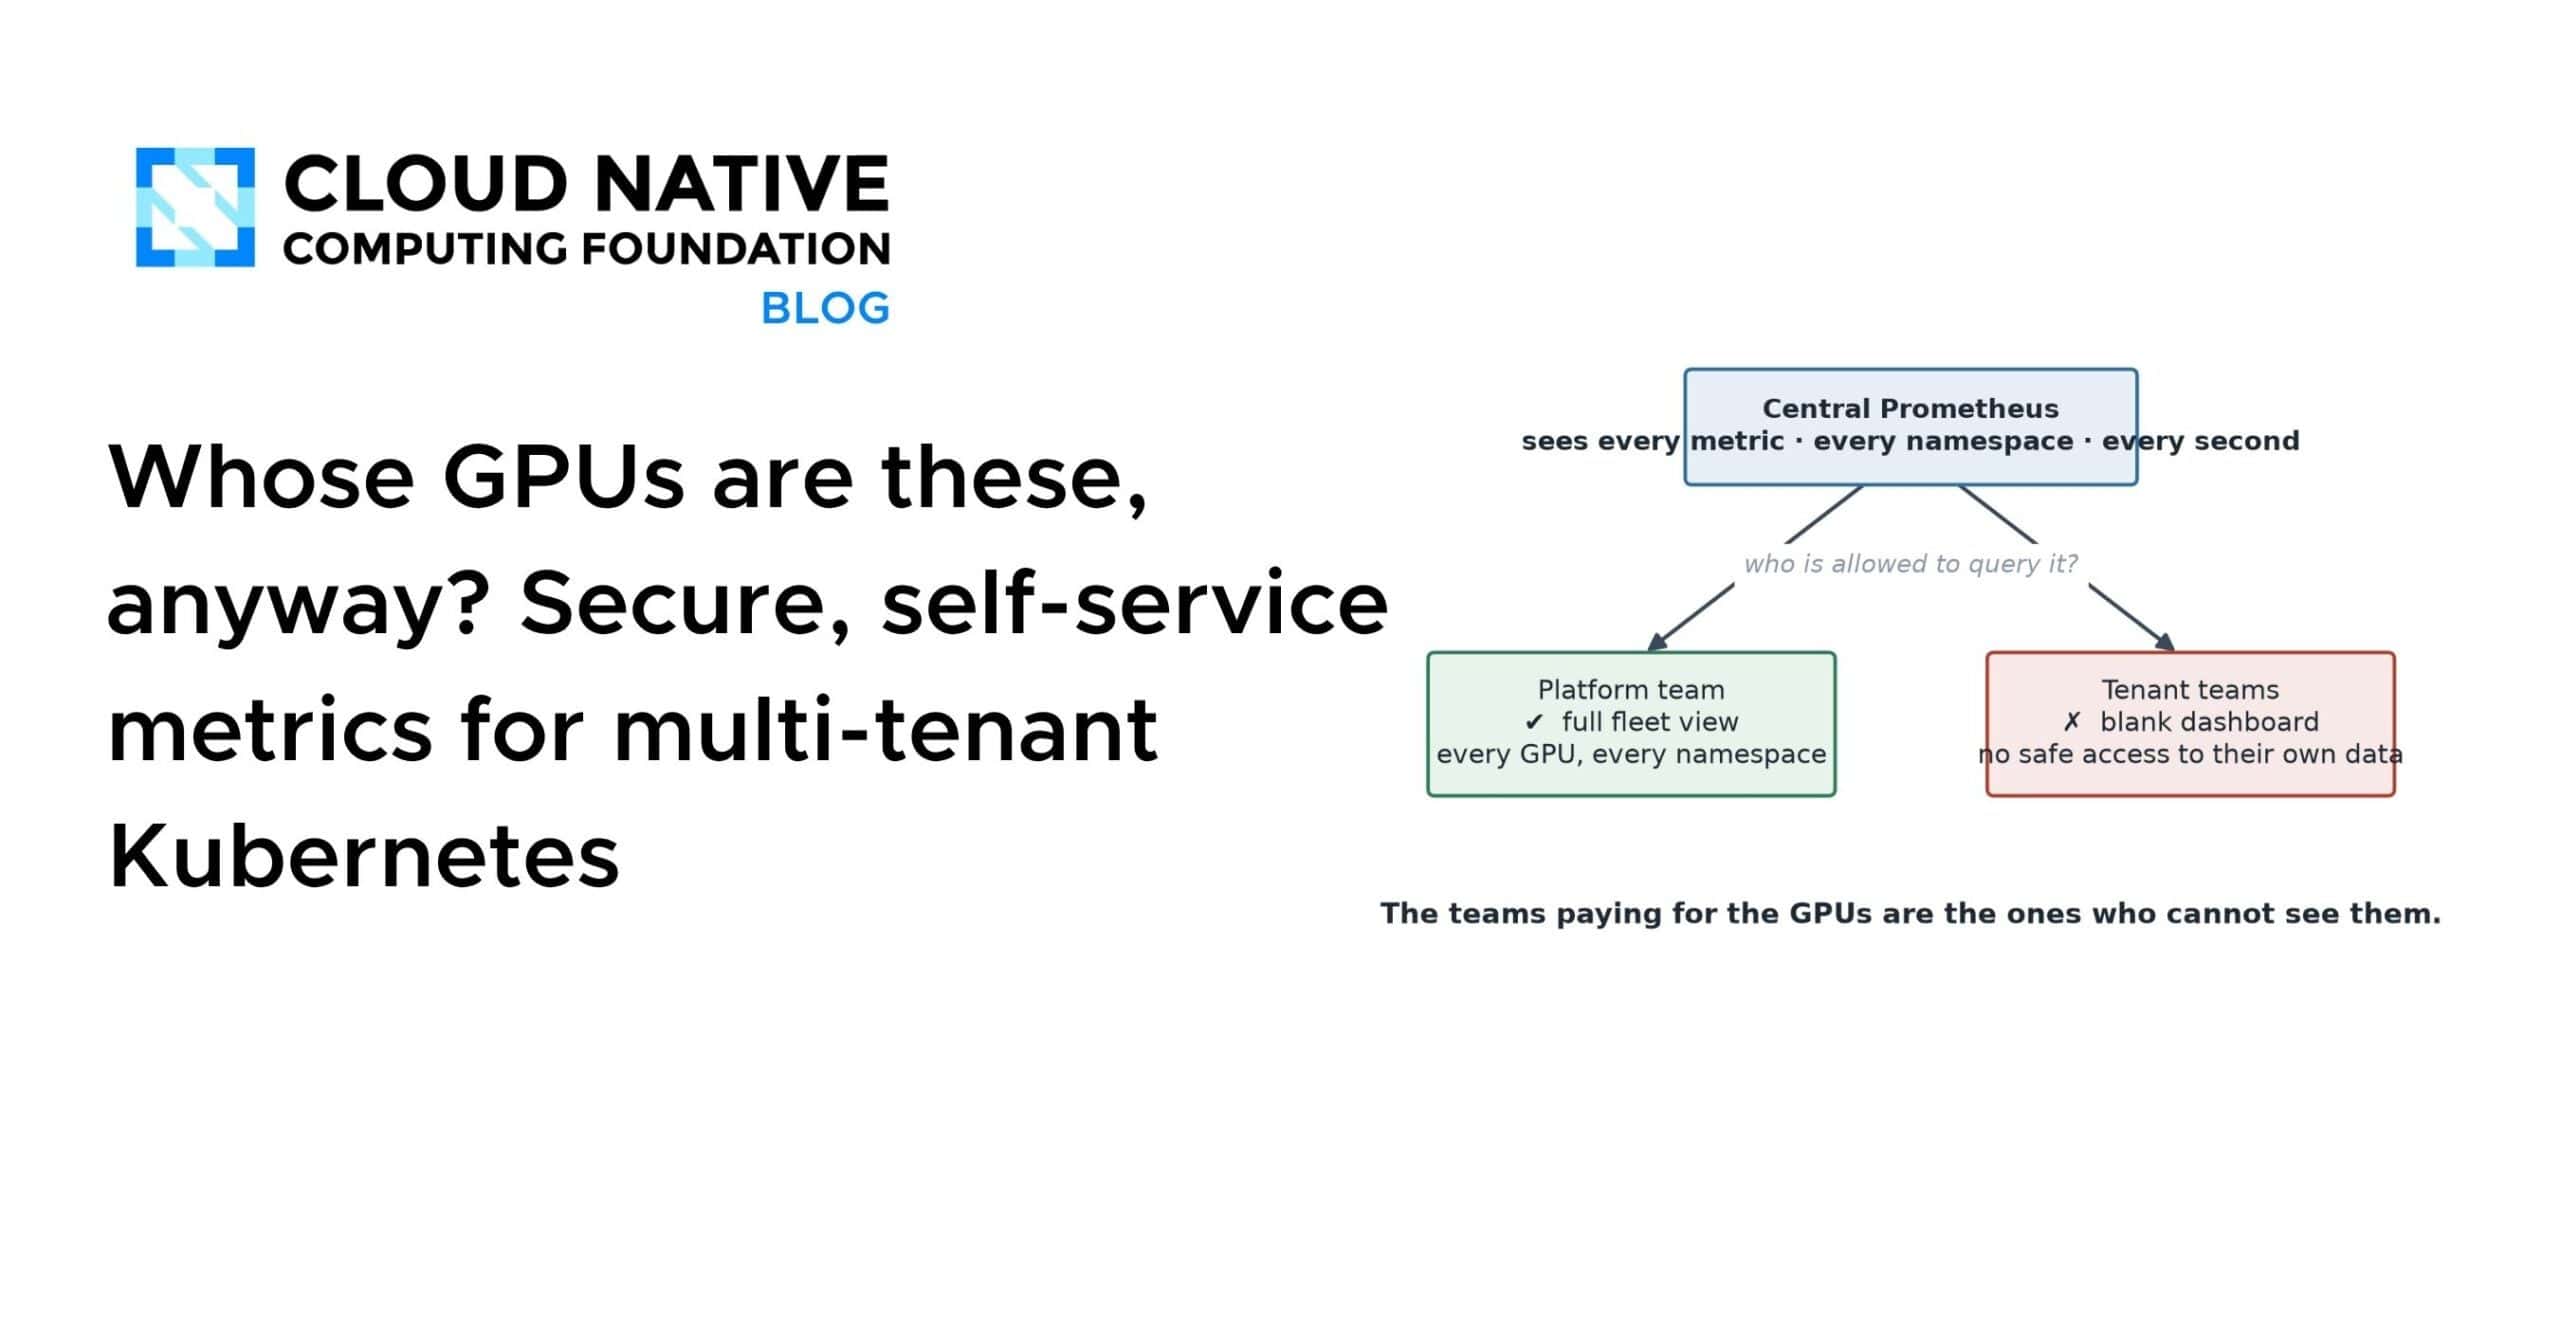
The irony was that the data existed. Every GPU utilization reading, captured every second, had been flowing into a centralized monitoring store for months. Thousands of namespaces across dozens of teams all fed into the same system. The metrics were there. They simply lived in a place no individual team was permitted to access, because a monitoring store that can see everything cannot safely be opened to any single group.
Visibility split into two worlds: the platform team could see all GPU activity, and the consuming teams could see nothing. Multiply one idle graphics card drawing full power for eleven straight days across a fleet of thousands, all while green health checks painted a picture of normal operation, and “we’re not sure” quietly becomes a significant monthly expense.
This article details how that gap was closed — how every team gained a safe, self-service window into their own GPU and compute metrics without exposing anyone else’s data, without introducing a new vendor platform, and without standing up an entirely separate monitoring stack.
—
## The Two Walls Blocking Visibility
The most obvious solution is to grant every team read-only access to the central monitoring store. In practice, this approach runs into two independent obstacles, each rooted in a decision that made perfect sense on its own.
**The security wall.** A monitoring query endpoint has no concept of namespaces. If a tenant can submit one query, they can submit any query — including one that reads another team’s request rates, capacity plans, or internal service latencies. “Read-only access for everyone” is not a security posture you can defend across thousands of namespaces.
**The scale wall.** The central store already handles scraping and storage for the entire fleet. Directing hundreds of engineers and their ad-hoc queries at it puts the shared infrastructure at risk. One team’s expensive range query can become everyone’s latency spike — the classic noisy neighbor problem.
Both concerns are legitimate. Together, they leave the data teams need locked inside a store you can safely open to them. The solution required giving each tenant an isolated, curated slice of the data, delivered directly to them.
—
## A Design Framework: Librarian, Not Library
The central monitoring store functions like a vast reading room where every team’s private notebooks sit on open shelves. Hand out a master key and you break confidentiality in the same motion. The moment a crowd arrives, the shared room grinds to a halt.
What is needed is a librarian — a tenant-aware proxy — that accepts your credentials, locates only your documents, and brings you a copy. Everything downstream of that proxy remains unchanged.
The design distilled into three essential operations:
– **Identify:** Authenticate the caller and determine which tenant they represent.
– **Isolate:** Restrict every query to that tenant’s namespace, enforced at a level below the query language so it cannot be bypassed.
– **Deliver:** Optionally replicate a curated subset of each tenant’s metrics into their own small, dedicated monitoring store, so their dashboards and alerts run against infrastructure they own.
The other half of the equation is self-service. Platform teams cannot hand-curate metric lists for thousands of namespaces. The answer is a lightweight contract: a small Kubernetes custom resource through which a team declares which metrics they need. The platform owns the plumbing; the tenant owns the policy.
—
## How It Works: Architecture and Components
The original infrastructure monitoring store continues operating exactly as it always did. Everything tenant-facing moves behind the proxy layer.
### The Read Path
A tenant’s query enters through a load balancer that distributes traffic across proxy replicas. It then passes through an authentication and authorization layer that verifies identity using native Kubernetes credentials and role-based access control. The proxy discovers backend monitoring instances through the Kubernetes API, fans the query across all healthy backends, filters the returned data to what the tenant is permitted to see, and delivers the aggregate response.
### The Write Path
On the collection side, the proxy periodically gathers each tenant’s curated metric subset and pushes it into that tenant’s own dedicated monitoring instance. For teams running high-availability setups, it resolves each replica’s pod DNS and writes to all instances, ensuring every replica holds identical data. None of this requires exotic tooling — standard remote-write mechanisms with a multi-tenancy model layered on top.
### Security Hardening
The proxy itself runs with a hardened configuration: it operates as a non-root process, uses a read-only root filesystem, drops all Linux capabilities, disables privilege escalation, and runs under a least-privilege service account. Defense in depth on the path that matters most.
### Tenant Isolation Enforcement
Two open source components handle the isolation requirements.
The first component manages authentication and authorization. It answers the questions “who is this caller, and are they permitted?” using the same Kubernetes identity and RBAC model already trusted for the API server. It carries the tenant’s identity forward as a namespace assertion that anchors every downstream decision.
The second component handles query-time isolation. This is the piece that makes cross-tenant data access impossible rather than merely discouraged: it rewrites every incoming query to inject a namespace filter before it reaches the backend store. Enforcement happens below the query language, so no query syntax can escape it.
—
## Collection-Time Isolation: Why It Matters
Read-time filtering prevents tenants from seeing each other’s data, but a tenant’s own monitoring store can still accumulate far more series than necessary. A setting that pushes isolation to the collection stage changes the picture entirely.
When collection-time filtering is enabled, metrics are gathered with the namespace filter already applied, meaning a tenant only ever ingests their own series. The difference is dramatic:
| Configuration | Series Stored | Query Speed | Isolation Level |
|—|—|—|—|
| Collection-time filtering disabled | ~10,000+ (all namespaces) | Slower (large dataset) | Query-time only |
| Collection-time filtering enabled | ~300 (single namespace) | Faster (focused dataset) | Collection + query time |
For a typical team, this represents roughly a ninety-seven percent reduction in stored series — from over ten thousand down to a few hundred. A smaller store queries faster, costs less, and cannot leak data it never collected. The noisy neighbor problem shrinks simultaneously, since the fleet-wide store is no longer on the critical path for everyday dashboards.
—
## Onboarding a Team: A Single YAML File
A new tenant onboardes by applying one configuration file that declares which metrics they want and where to deliver them. The configuration supports three styles of metric matching — exact names, regular expressions, and PromQL selector expressions — all mixed freely within the same file.
Once applied, the proxy begins collecting and delivering the requested metrics. The team queries their own dedicated store through a standard API call, authenticated with their tenant identity in a request header.
—
## Queries That Unlock GPU Cost Visibility
Once a team can see their GPU metrics, a handful of queries deliver most of the value. These assume a standard GPU exporter is in use; metric names should be adjusted to match your specific exporter.
**Average GPU utilization per namespace** — the headline number most teams are missing:
`avg by (namespace) (gpu_utilization_metric)`
**Count of effectively idle GPUs** — utilization below five percent for the last hour. This is where the hidden spend lives:
`count by (namespace) (avg_over_time(gpu_utilization_metric[1h]) < 5)`**GPU memory usage versus total capacity** — separates "busy and memory-constrained" from "reserved but empty":`sum by (namespace) (gpu_memory_used) / sum by (namespace) (gpu_memory_used + gpu_memory_free)`**Power draw per namespace** — a rough real-time proxy for cost:`sum by (namespace) (gpu_power_draw)`**High utilization with no incoming traffic** — GPUs running hot while the ingress layer is silent, often indicating a stuck or orphaned workload:`avg by (namespace) (gpu_utilization_metric) > 70 and sum by (namespace) (rate(ingress_requests[5m])) < 1`**Incoming traffic with idle GPUs** — requests arriving while graphics cards sit unused, pointing at a scheduling gap rather than a capacity shortage:`sum by (namespace) (rate(ingress_requests[5m])) > 10 and avg by (namespace) (gpu_utilization_metric) < 5`The idle-GPU query alone closed the loop for the original team. It surfaced hardware that had been drawing power for hours without doing any work — capacity they could finally see, understand, and reclaim.---## Guardrails and Lessons LearnedSelf-service without limits simply relocates the noisy neighbor problem to a new tier of the stack. Several guardrails keep the system healthy:**Self-service still needs curation.** When a team requests "all metrics," they usually mean "I don't yet know which ones I actually need." Good defaults and guided selection outperform an unrestricted allowlist every time.**Cardinality is a cost decision.** Collection-time filtering is the difference between a store holding a few hundred series and one holding tens of thousands. Enable it by default unless a team has a specific cross-namespace requirement.**Delivery needs resilience engineering.** Retry logic, backoff strategies, and multi-replica writes for high-availability tenants are not optional extras — they require upfront budgeting for failure modes.**Full isolation can be overkill for small teams.** Lightweight teams doing simple dashboarding work fine with filtered query access alone. Reserve dedicated per-tenant stores for teams that run real-time dashboards and alerting pipelines.**Metric names drift across clusters.** A surprising share of early "no data" tickets resulted from queries referencing metric names that the exporter did not actually emit. Pin exporter versions and maintain a documented registry of exact series names.The pattern generalizes beyond GPU workloads. It applies to any multi-tenant cluster scenario: an authentication and authorization proxy, label-enforced isolation enforced below the query language, and optional per-tenant data replication — all built from open source components already familiar to most platform teams.---## Frequently Asked Questions**Why not just give teams read access to the central monitoring store?** Read access to a shared store creates two serious problems. First, there is no namespace-level scoping — a tenant can query any data in the system, including other teams' metrics. Second, heavy query loads from multiple teams can degrade performance for everyone, creating a noisy neighbor scenario that impacts production alerting and dashboards.**What happens if a tenant's Prometheus instance goes down?** The proxy handles this through dynamic backend discovery. It identifies healthy instances via the Kubernetes API and routes queries only to available replicas. For write paths, the proxy resolves all HA replica DNS entries and pushes data to each one, so failover is transparent and automatic.**Can tenants use PromQL selectors in their MetricAccess configuration?** Yes. The onboarding configuration supports three matching styles simultaneously: exact metric names, regular expressions, and full PromQL selector expressions. This gives teams the flexibility to target precisely the data they need.**Is collection-time filtering always necessary?** No. Smaller teams with simple dashboarding needs perform adequately with query-time filtering alone. Collection-time filtering becomes valuable for teams that own production dashboards and alerting pipelines, or for tenants where storage cost and query performance are significant concerns.**What if a team's metric names don't match what the exporter emits?** This was one of the most common early issues. The recommendation is to pin exporter versions, document expected series names, and include validation checks in the onboarding workflow to catch mismatches before they become debugging sessions.**Does this approach require a new monitoring stack?** No. The entire solution builds on components a platform team likely already runs: a central monitoring store, Kubernetes, and standard remote-write protocols. The proxy layer is the only new piece, and it is intentionally thin.**How does this handle teams running across multiple clusters?** The same primitives apply: dynamic backend discovery, independent per-tenant remote-write, and writes to all high-availability replicas. The proxy can resolve backends across clusters, making multi-cluster observability a natural extension of the same architecture.**What license is the proxy component available under?** The proxy is distributed under an open source license that permits commercial use, modification, and redistribution. The custom resource definitions and reference configurations are also available as open source artifacts.---## ConclusionThe pattern described here — a lightweight, tenant-aware proxy that authenticates callers, enforces namespace-level isolation below the query language, and optionally replicates curated metrics into per-tenant stores — solves one of the most persistent visibility challenges in multi-tenant Kubernetes environments.No proprietary platform is required. No vendor lock-in is introduced. The entire solution is composed of components that platform teams already operate and trust. The result is a system where GPU spend is no longer a mystery line item, idle hardware is caught within hours rather than weeks, and every team can see their own costs without ever being given access to someone else's data.The original team went from blank dashboards to a dedicated monitoring instance of their own — with the ability to surface idle capacity in under an hour. That is not a small improvement. It is the difference between an infrastructure budget that is a source of uncertainty and one that is fully understood.---Thank you for reading
