


Bitcoin (BTC) is holding steady around $64,000 as the new week begins, yet traders are keeping a close eye on several upcoming events that could shake things up.
Main takeaways:
- The US dollar is gaining strength again, and past trends suggest Bitcoin struggles when the DXY is strong.
- July has historically moved in the opposite direction of June, which could mean some relief for BTC prices ahead.
- Fresh PCE inflation figures are expected, while uncertainty lingers over US-Iran peace talks.
- Bitcoin’s growing link to oil prices is increasing confidence that the $60,000 support level will hold.
- While short-term holders may have exited their positions, large investors aren’t showing signs of giving up at these price levels.
Bitcoin traders brace for a stronger US dollar
A well-known obstacle for Bitcoin’s price movement is back in the spotlight this week as diplomatic efforts to resolve the US-Iran conflict continue.
The US dollar index (DXY) has climbed back above 100, reaching its highest point in more than a year, according to TradingView data.
BTC/USD vs. US dollar index (DXY) four-hour chart. Source: Cointelegraph/TradingView
The DXY tracks the dollar’s value against a group of major trading partner currencies and usually moves in the opposite direction of crypto markets. Continued dollar strength could therefore limit gains across crypto and other risk assets.
“Breaking through the key 100 mark with support from its Daily 200MA/EMA,” trader Daan Crypto Trades noted in a weekend post on X, pointing to the 200-day simple and exponential moving averages.
“If it manages to stay above 100, that could weigh on risk assets. Definitely worth watching.”
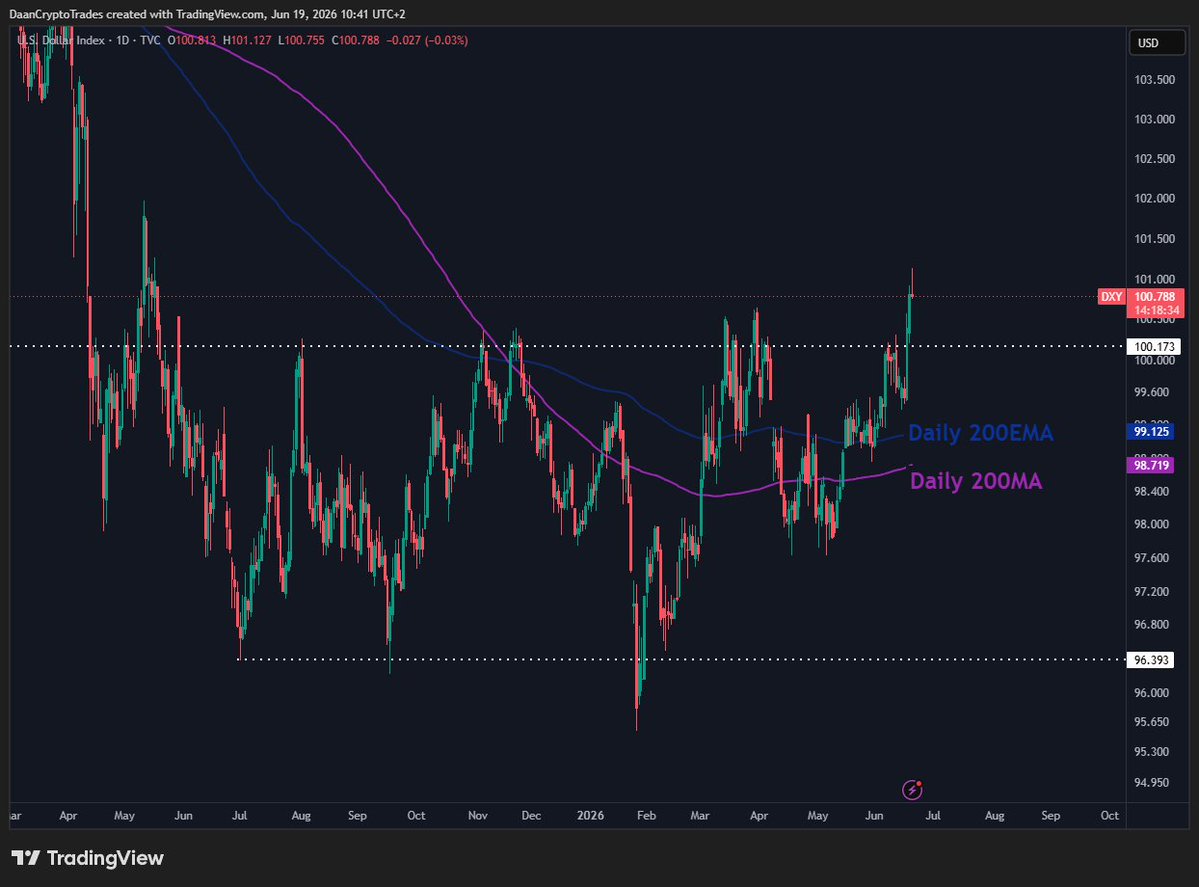
US dollar index (DXY) one-day chart. Source: Daan Crypto Trades/X
Trader Benjamin Cowen pointed out that the bullish outlook for DXY could extend into the second half of 2026.
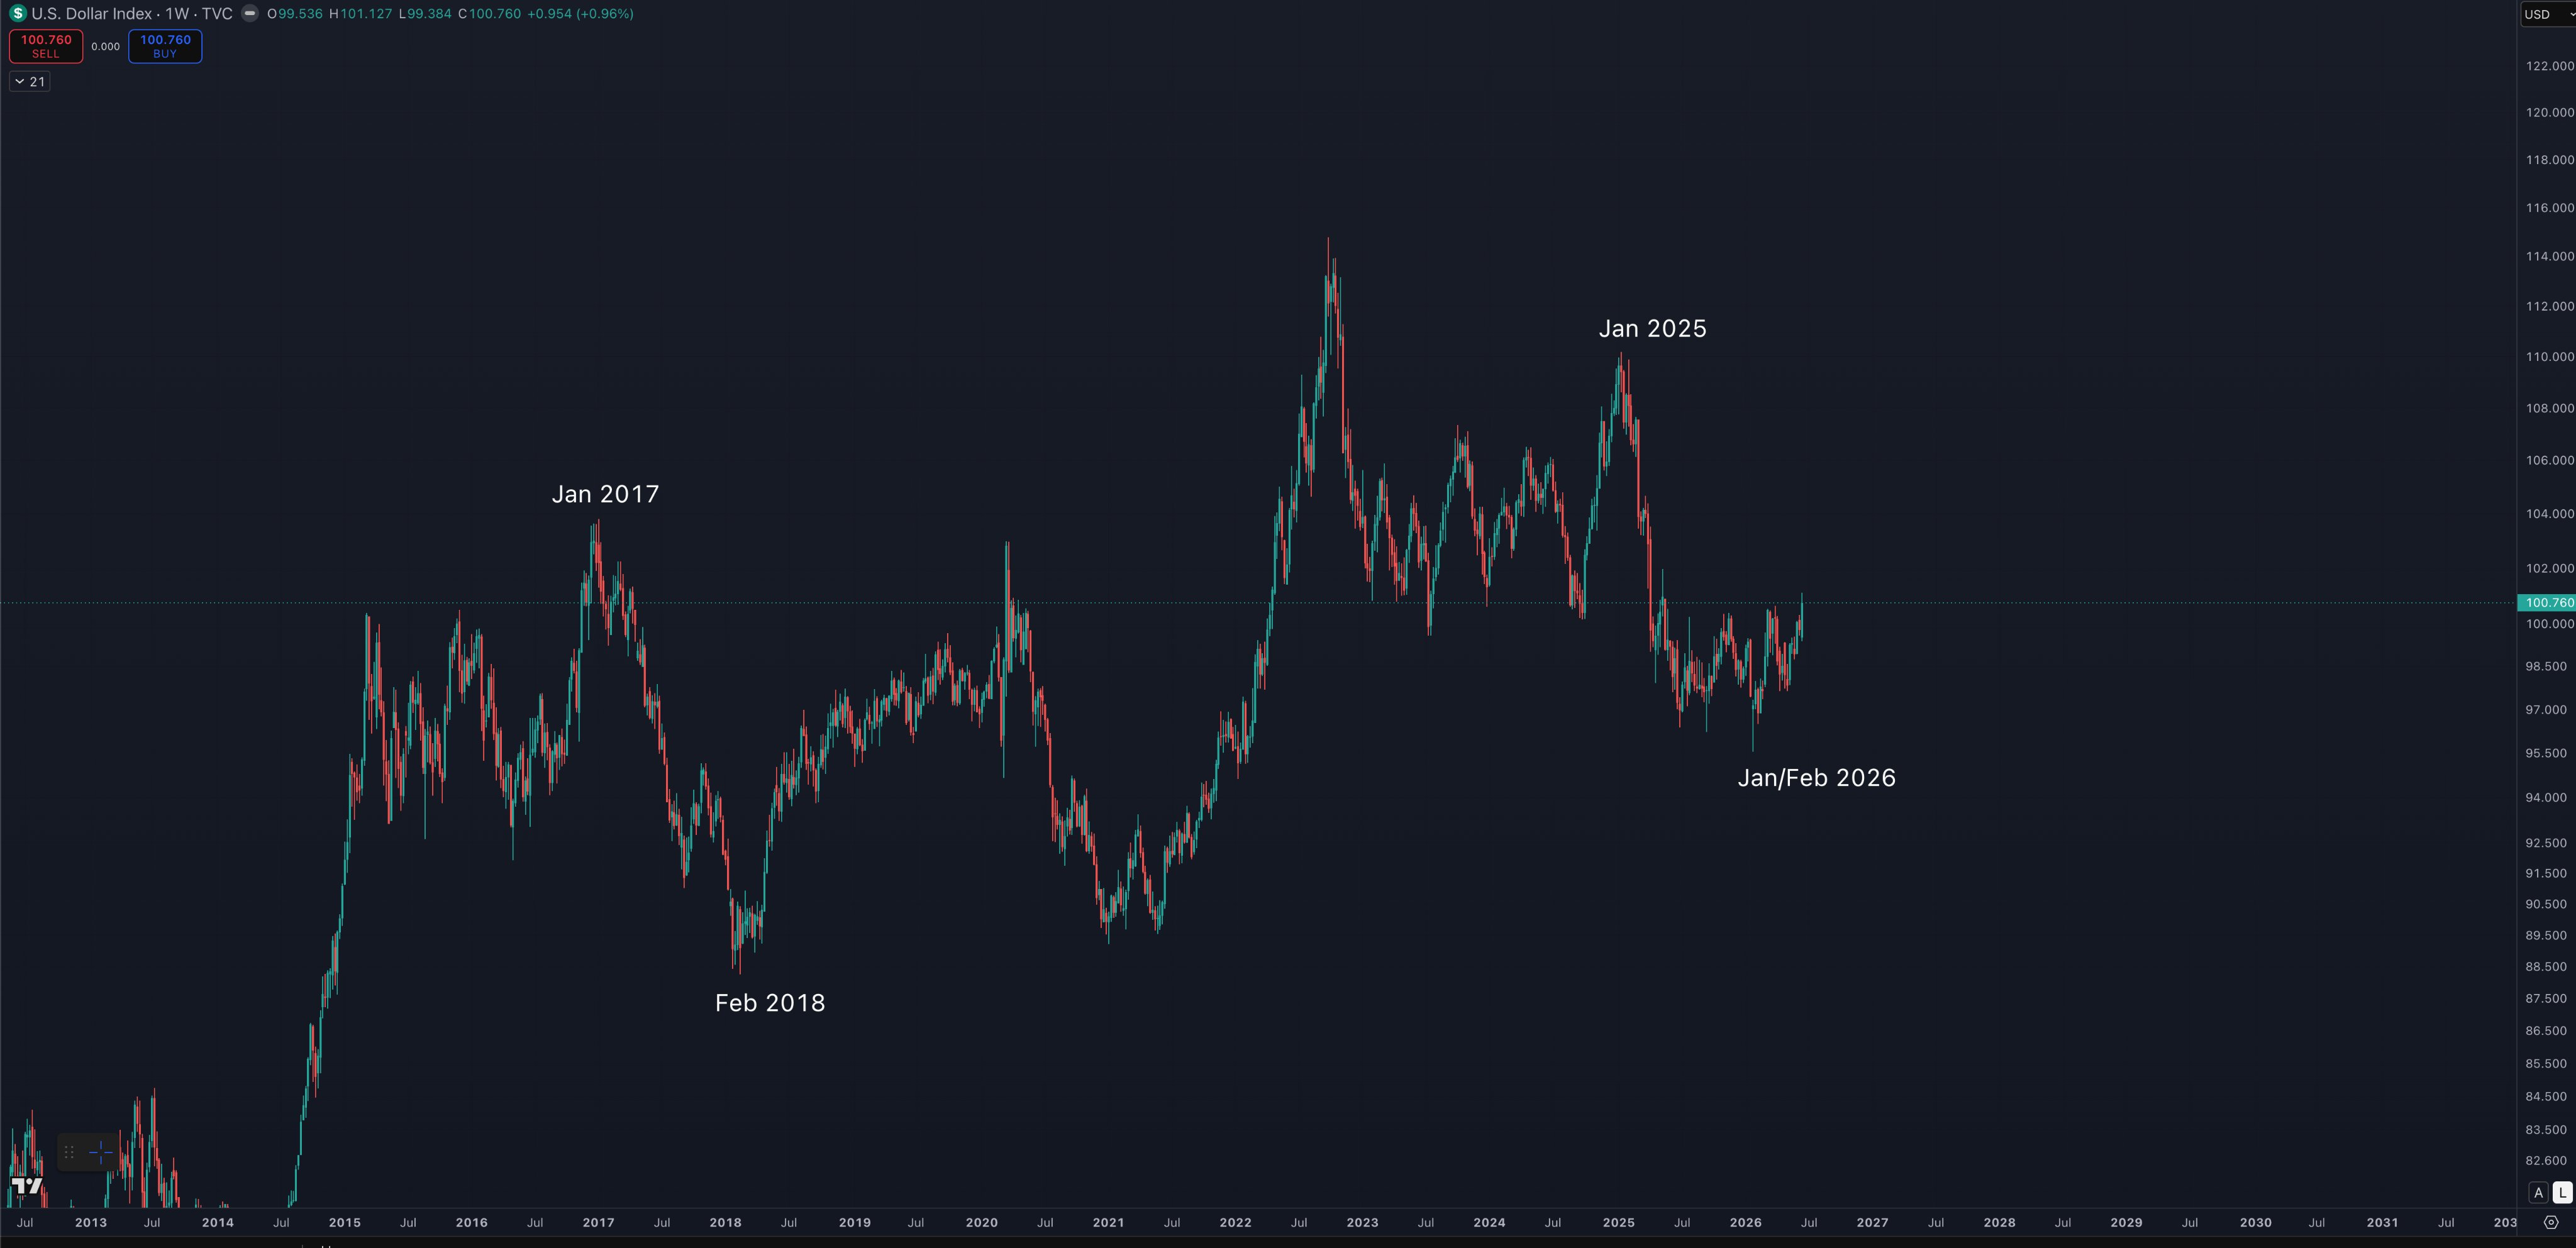
US dollar index (DXY) one-week chart. Source: Benjamin Cowen/X
“$DXY is currently testing the upper boundary of a megaphone or broadening wedge pattern. A breakout above this pattern rather than a rejection would point to a significant upward target—somewhere near 106,” added ColinTalksCrypto, the creator of the YouTube channel bearing that name.
“That wouldn’t be good for risk assets either.”
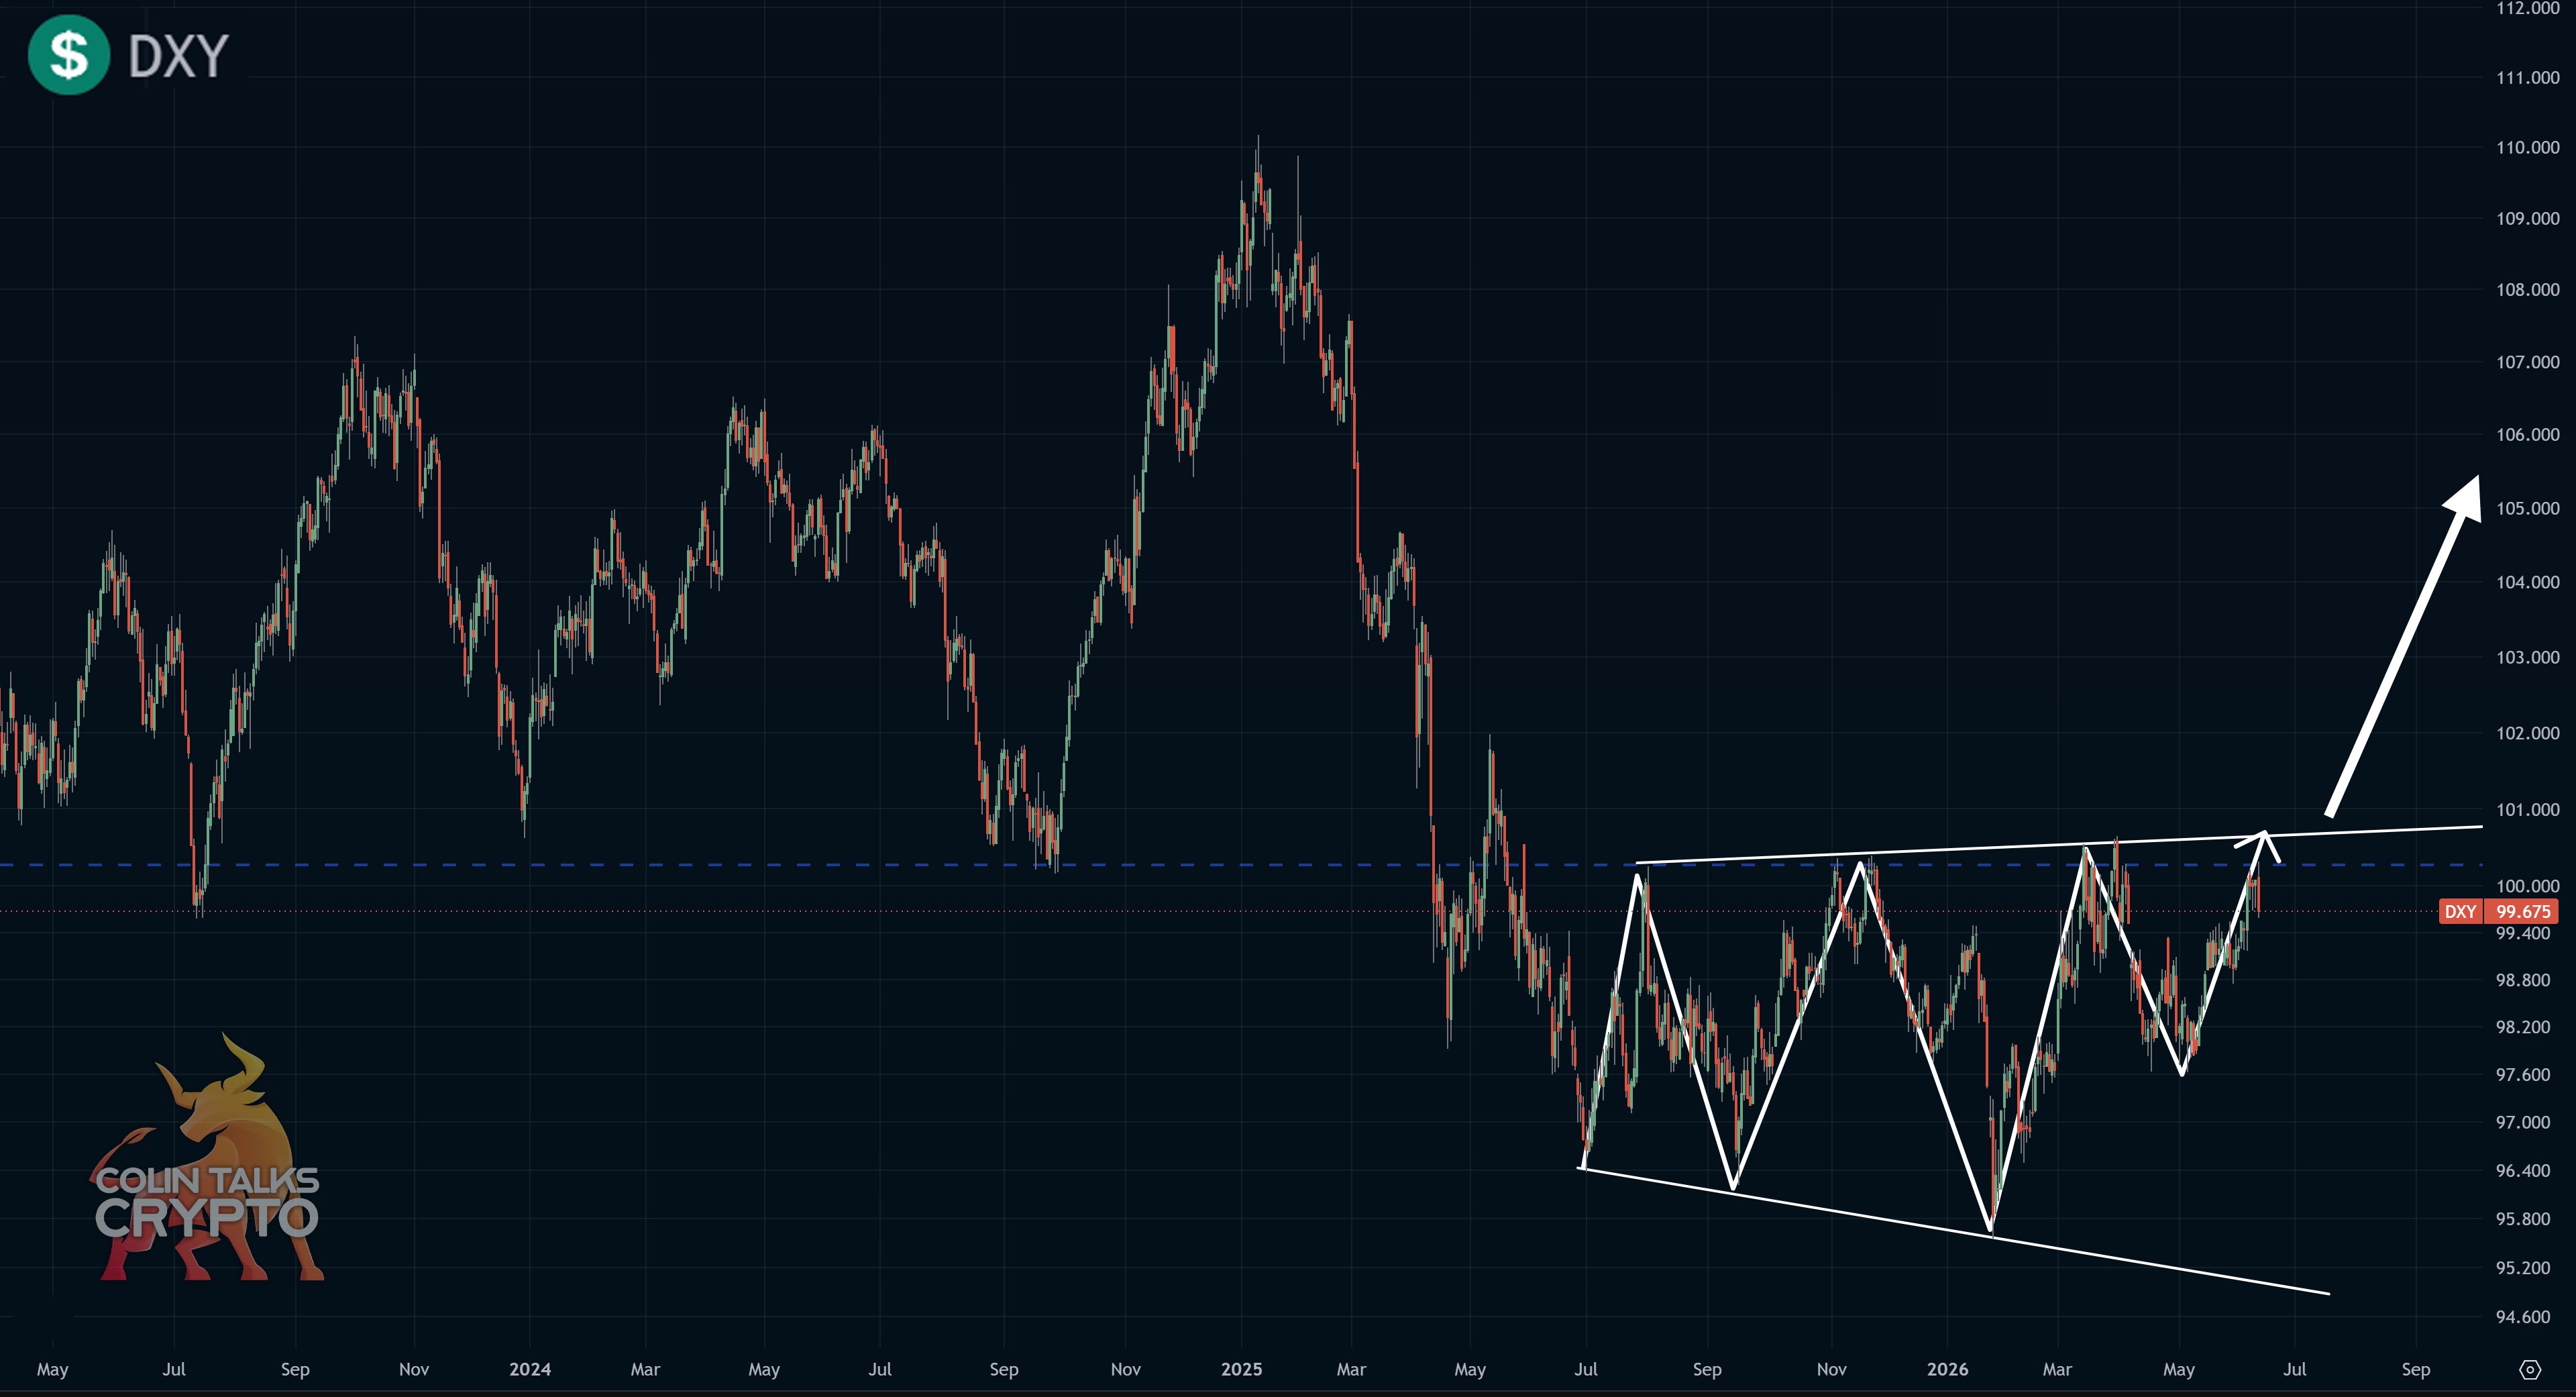
US dollar index (DXY) chart. Source: ColinTalksCrypto/X
Trader Aksel Kibar predicted a “pivotal week” for DXY, watching for the conclusion of a year-long consolidation phase.
Bitcoin remains near $64,000 after experiencing some brief price swings following the weekly close.
BTC price could get a boost in July
In his most recent market analysis, trader and analyst Rekt Capital offered an encouraging perspective for Bitcoin supporters.
Even though BTC has shown weakness this month, the historical pattern between June and July suggests the selling pressure could soon let up.
“History shows that whatever June does, July tends to do the reverse,” he shared with X followers over the weekend.
“So if June closes in the red, July is likely to turn green.”
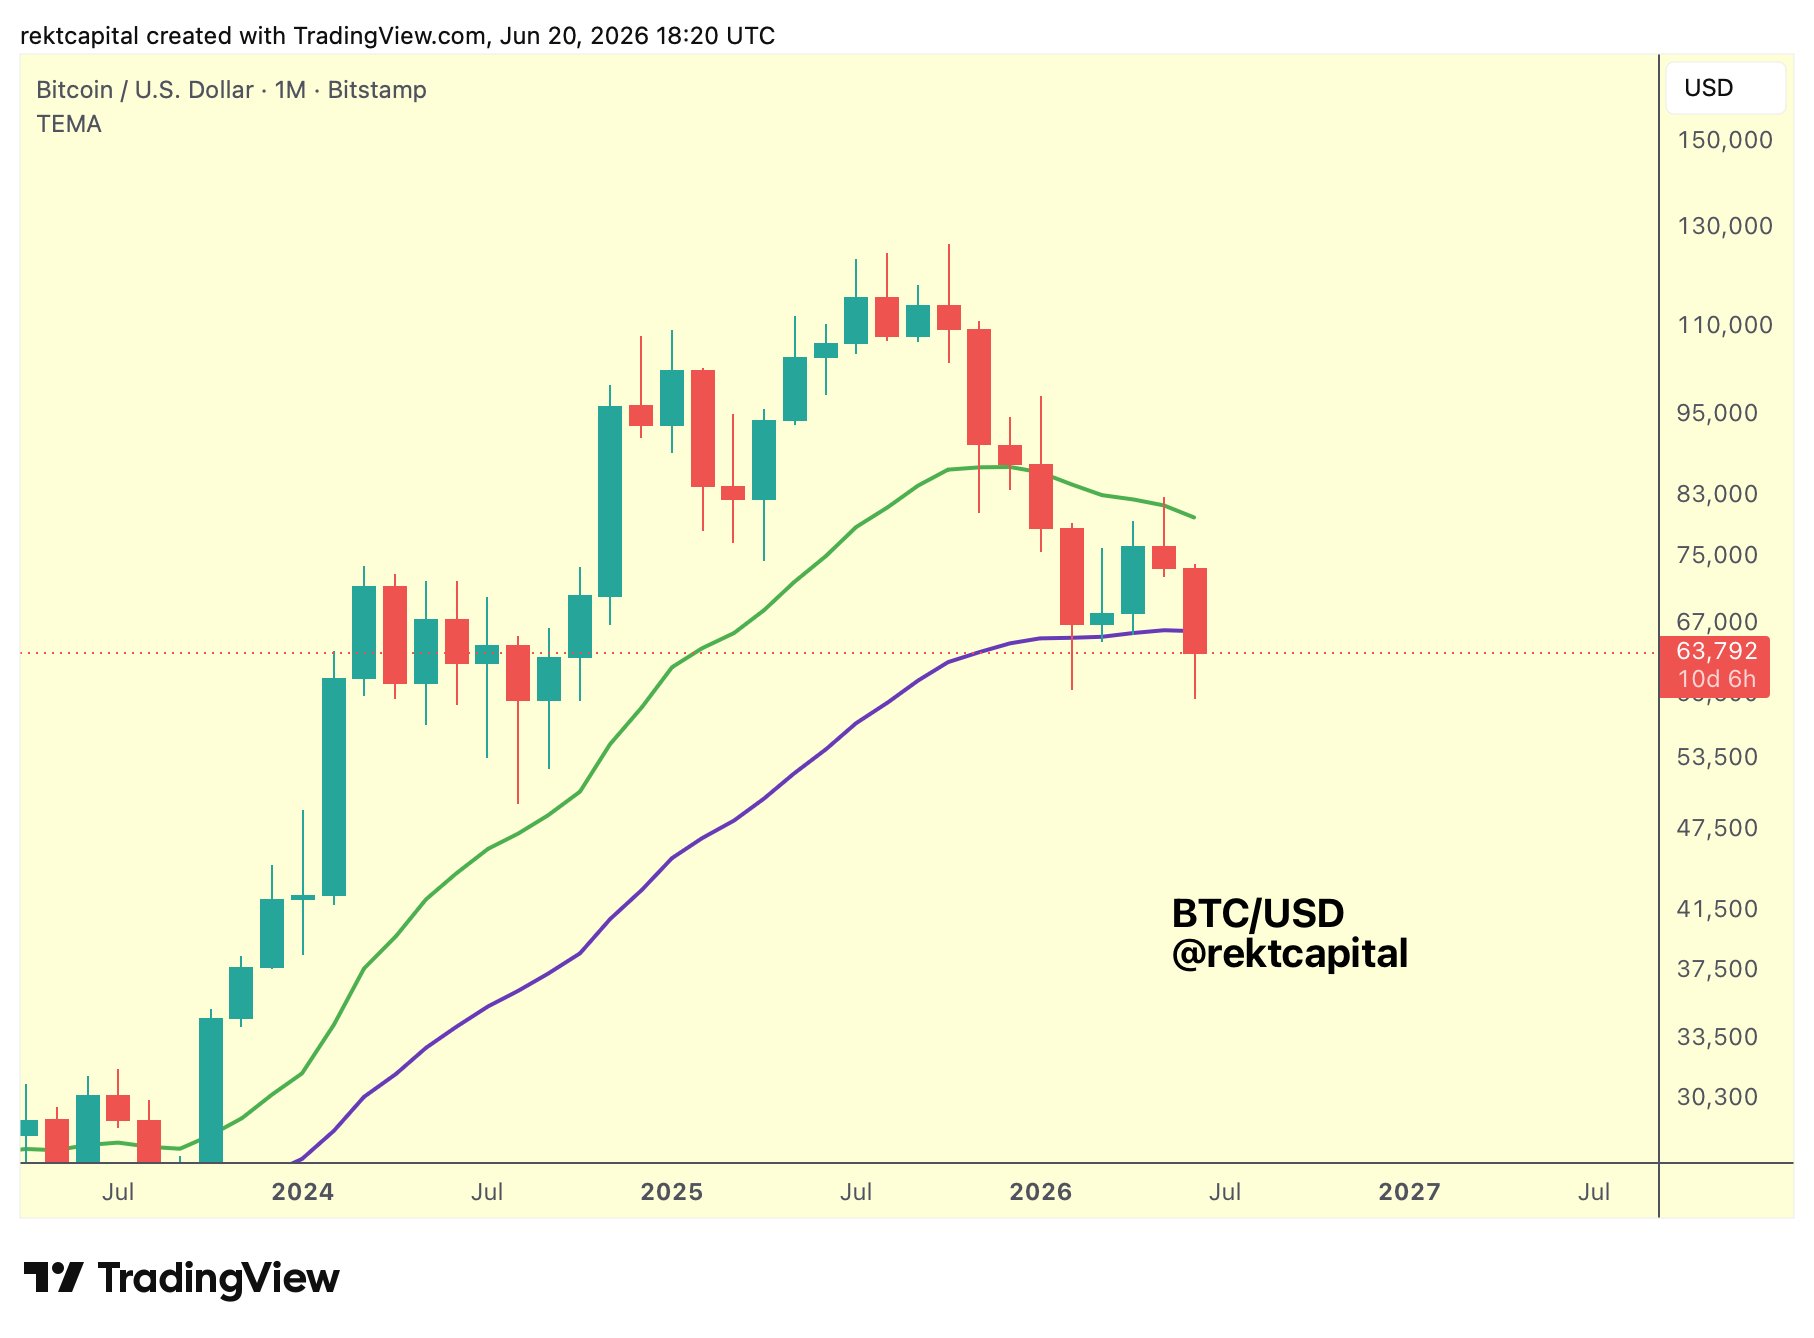
BTC/USD one-month chart with 21, 50EMA. Source: Rekt Capital/X
A supporting chart illustrated BTC/USD trading within a range defined by its 21-month and 50-month EMAs.
“If June closes this way, it would confirm the loss of the 50-Month EMA as support. In that case, July would likely see a relief rally that turns the EMA into new resistance,” Rekt Capital explained.
This scenario suggests that in the months ahead, Bitcoin bulls may need to deal with further downside pressure. Previously, Rekt Capital argued that the bear market still has room to run for several more months, drawing on historical patterns.
“History indicates there’s still time remaining and potentially more downside ahead,” he repeated on X while drawing comparisons to past bear markets.
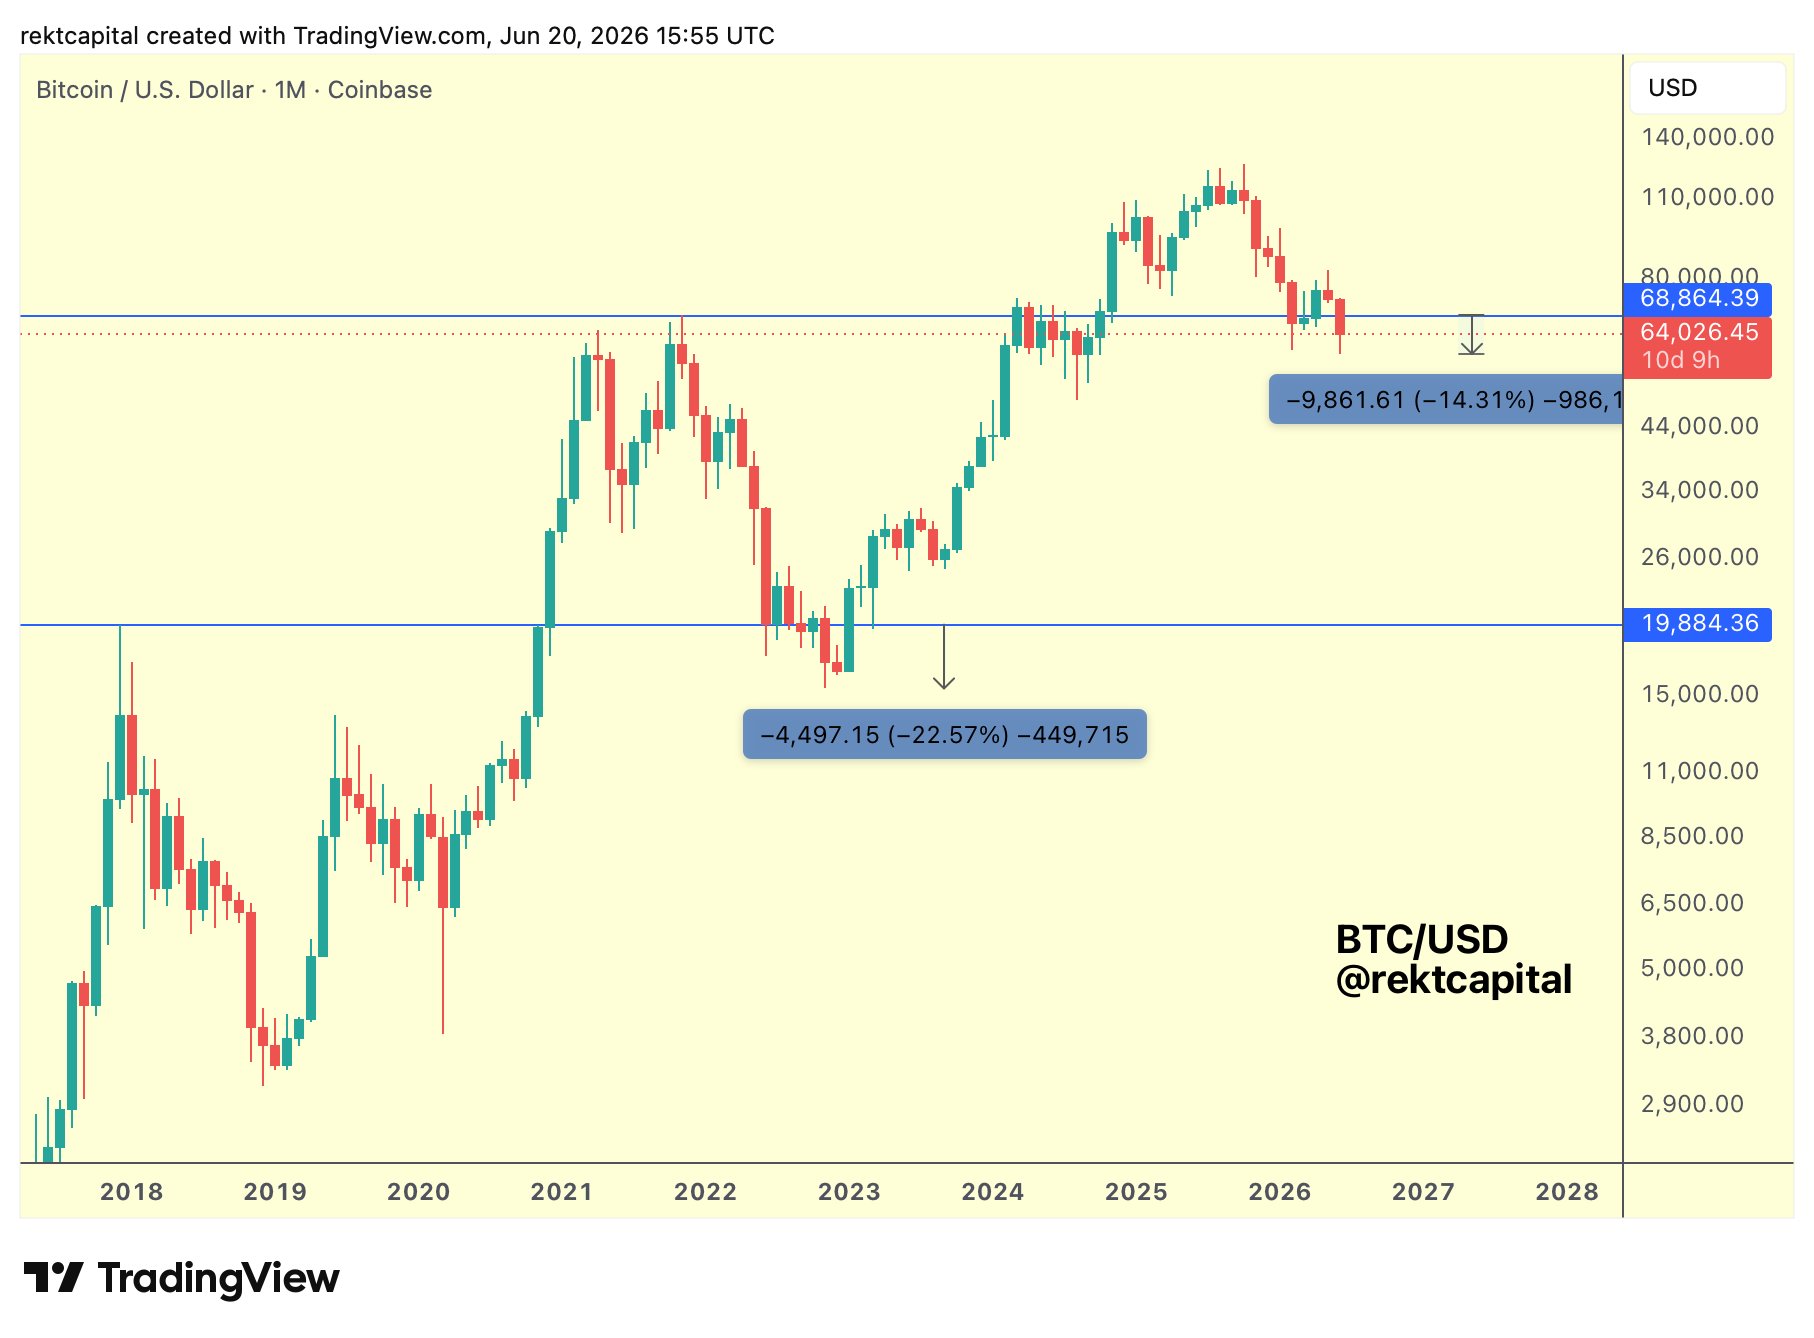
BTC/USD one-month chart. Source: Rekt Capital/X
PCE data arrives amid fragile US-Iran peace efforts
Inflation continues to dominate market attention this week as the Federal Reserve’s “go-to” inflation gauge takes center stage in the economic calendar.
The May reading of the Personal Consumption Expenditures (PCE) index is scheduled for release on Thursday.
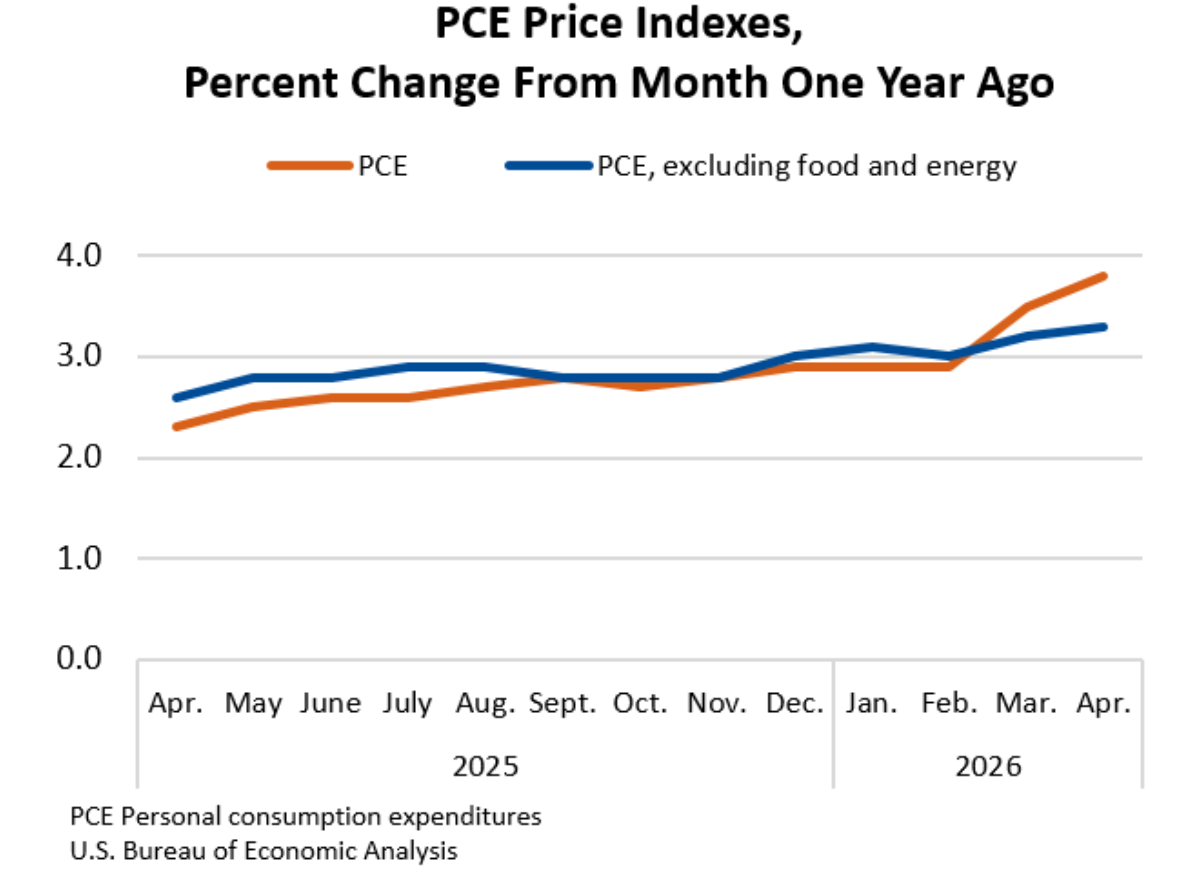
US PCE index % change (screenshot). Source: US Bureau of Economic Analysis
April’s PCE figure reached a three-year peak, reflecting the ongoing influence of the US-Iran conflict on inflation dynamics.
“While investors are counting on the US-Iran agreement and the resulting drop in oil prices to cool inflation, price pressures are expanding beyond just energy,” noted trading resource Mosaic Asset Company in its latest newsletter edition, The Market Mosaic.
“The reason is that multiple factors are converging simultaneously to push inflation higher.”
Mosaic pointed to “substantial” federal budget deficits and supply-chain disruptions as key drivers of rising costs.
“Energy price increases and the fallout from last year’s trade war are likely playing a major role,” the report added, alongside a chart showing Producer Price Index (PPI) data.
“As you can see, supply chain pressures tend to precede shifts in producer prices.”
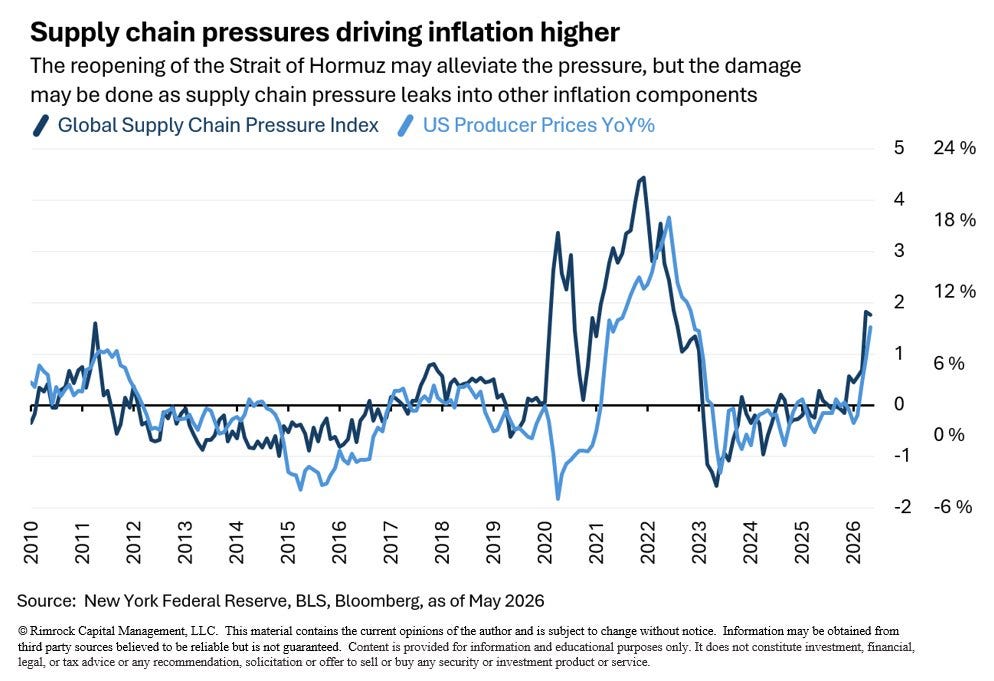
Global supply-chain and producer price index data. Source: Mosaic Asset Company
Rising inflation typically reduces the likelihood of the Federal Reserve lowering interest rates, which in turn puts downward pressure on cryptocurrencies and other risk-sensitive assets. As Cointelegraph reported, market participants are now even pricing in the possibility of the Fed raising rates before the year is out.
The most recent figures from CME Group’s FedWatch Tool show roughly a 36% probability of a rate increase at the Fed’s upcoming meeting in late July.
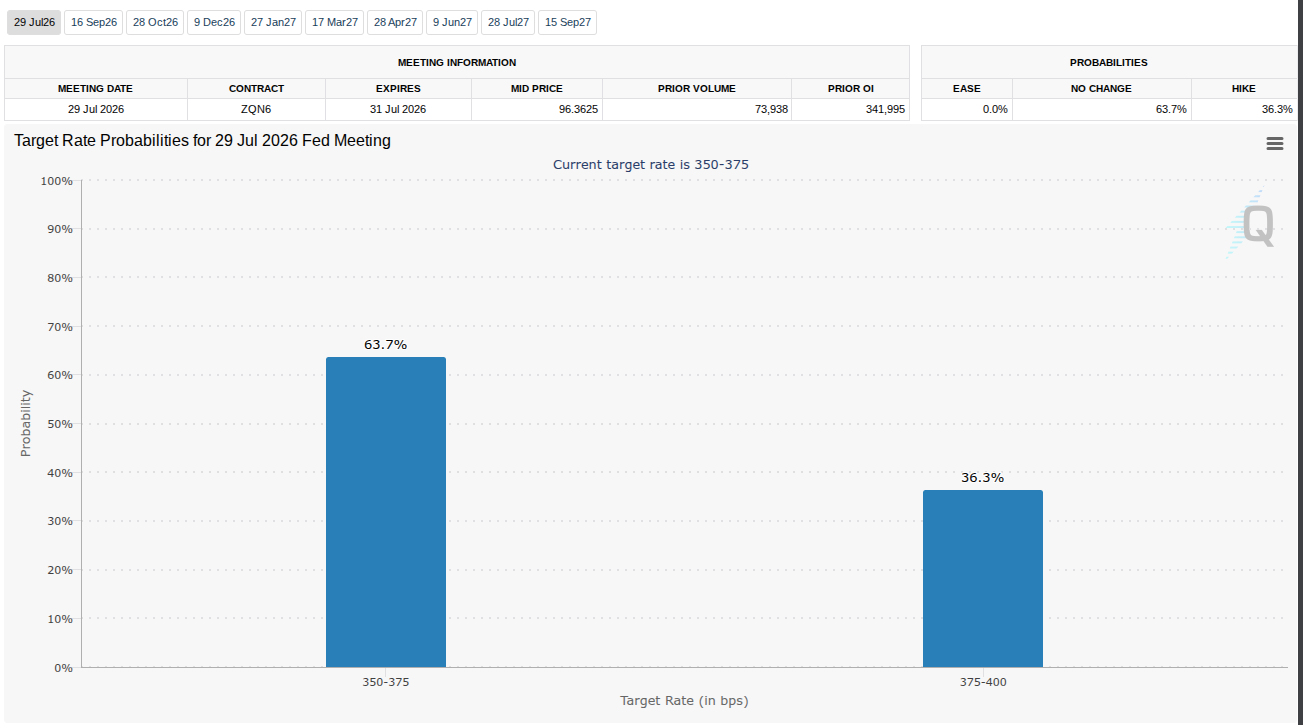
Fed target rate probabilities for the July 29 FOMC meeting (screenshot). Source: CME Group
“Stubbornly high inflation isn’t the only factor pushing the Fed toward a potential rate hike. Recent economic indicators have also been coming in stronger than expected,” Mosaic observed.
In addition to the PCE report, Thursday’s economic calendar includes revised first-quarter GDP figures and initial jobless claims data.
Oil prices help sustain the $60,000 support level
The US-Iran peace agreement, despite already showing early signs of fraying, has left a lasting mark on oil markets.
When the deal was signed, US WTI crude dropped to $73 per barrel, hitting its lowest point since early March and falling nearly 40% from its recent peak.
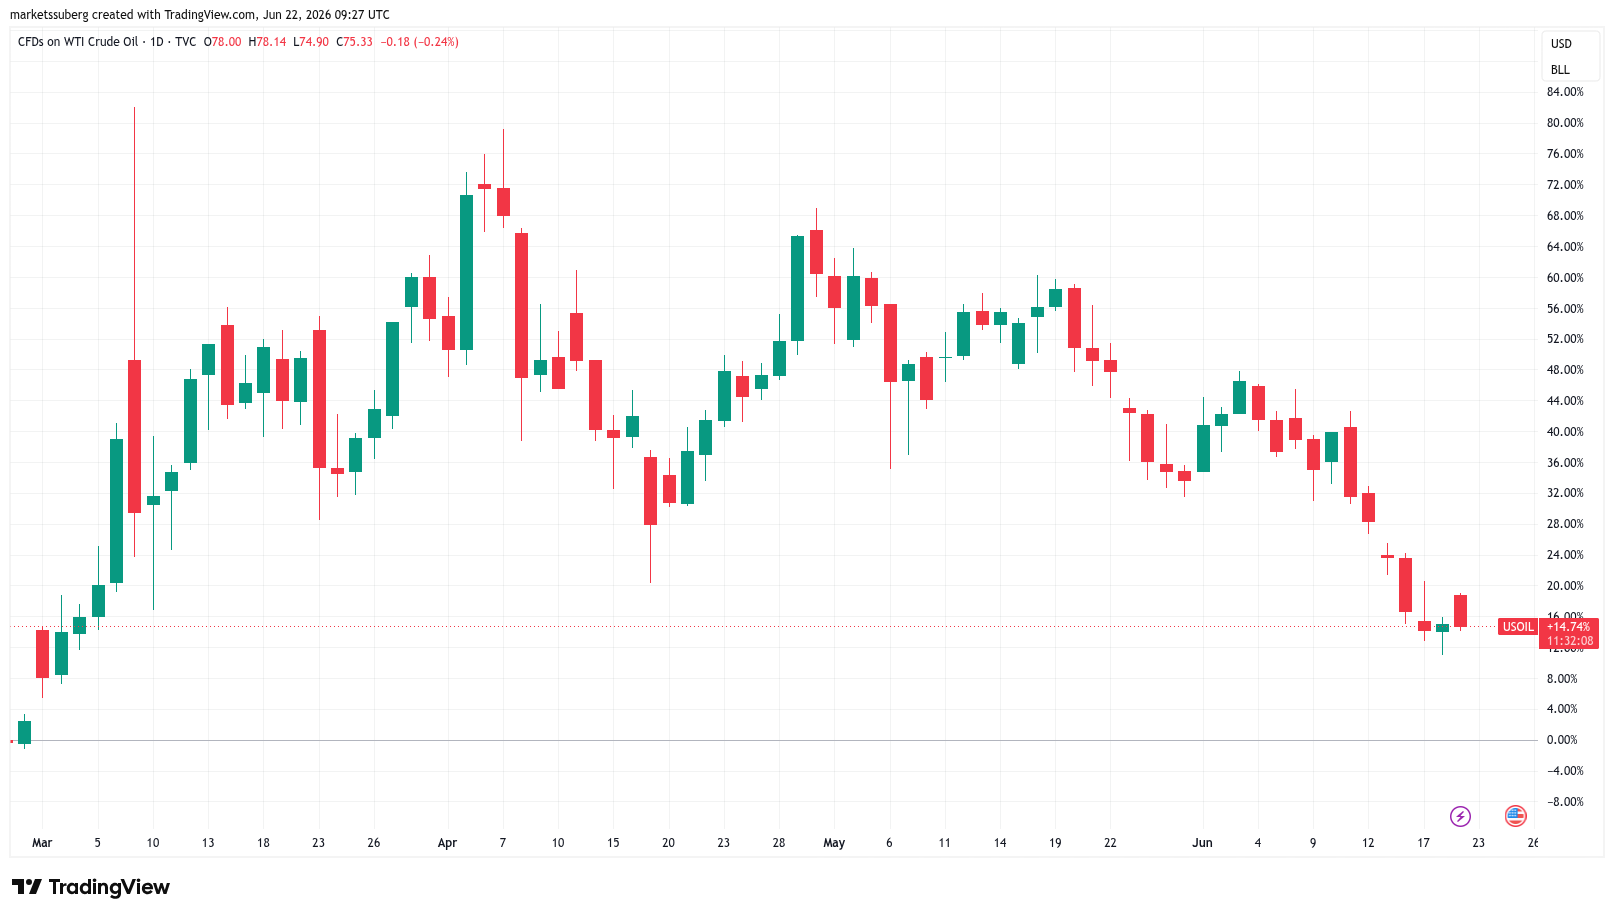
CFDs on US WTI crude oil, daily chart. Source: Cointelegraph/TradingView
Historically, Bitcoin has moved in the opposite direction of oil prices. However, recent weeks have shown a shift in that dynamic, with risk assets rallying while the peace deal continues to provide a floor near the mid-$60,000 range.
Onchain analytics firm Glassnode argues that oil’s recent trajectory should give Bitcoin optimists some near-term reassurance.
“Both Bitcoin and gold have been rallying,” the firm noted in a video analysis late last week, pointing out that accumulation patterns are helping to defend $60,000 as a local bottom.
Glassnode highlighted “solid” buying activity at lower price levels.
“I think there’s a reasonable chance this could hold as a lasting bottom — perhaps not the ultimate low, but I believe there’s a solid probability that the $60,000 level will be supported by a wide range of investor groups,” the analysis concluded.
Bitcoin short-term traders grow “emotional”
As Cointelegraph reported, the world’s largest exchange, Binance, has drawn attention in recent days due to noticeable Bitcoin sell pressure.
Related: Bitcoin market cap recovery could take ‘5-10 years’ after falling 10 spots since mid-2025
In its latest research, onchain analytics platform CryptoQuant breaks down the magnitude of the sell-off, which appears to be driven largely by newer market participants.
“Once again, short-term holders bore the brunt of this correction and reacted the most aggressively,” contributor Darkfost wrote on Sunday.
Darkfost was referring to short-term holders (STHs) — investors who have held their coins for six months or less. With BTC/USD sliding back to February lows, representing a nearly 30% decline from its May high, this group responded in an “emotional” manner.
“Over the course of June, STH inflows to Binance surpassed 80,000 BTC within a 7-day window, translating to roughly $5 billion in selling pressure,” Darkfost reported.
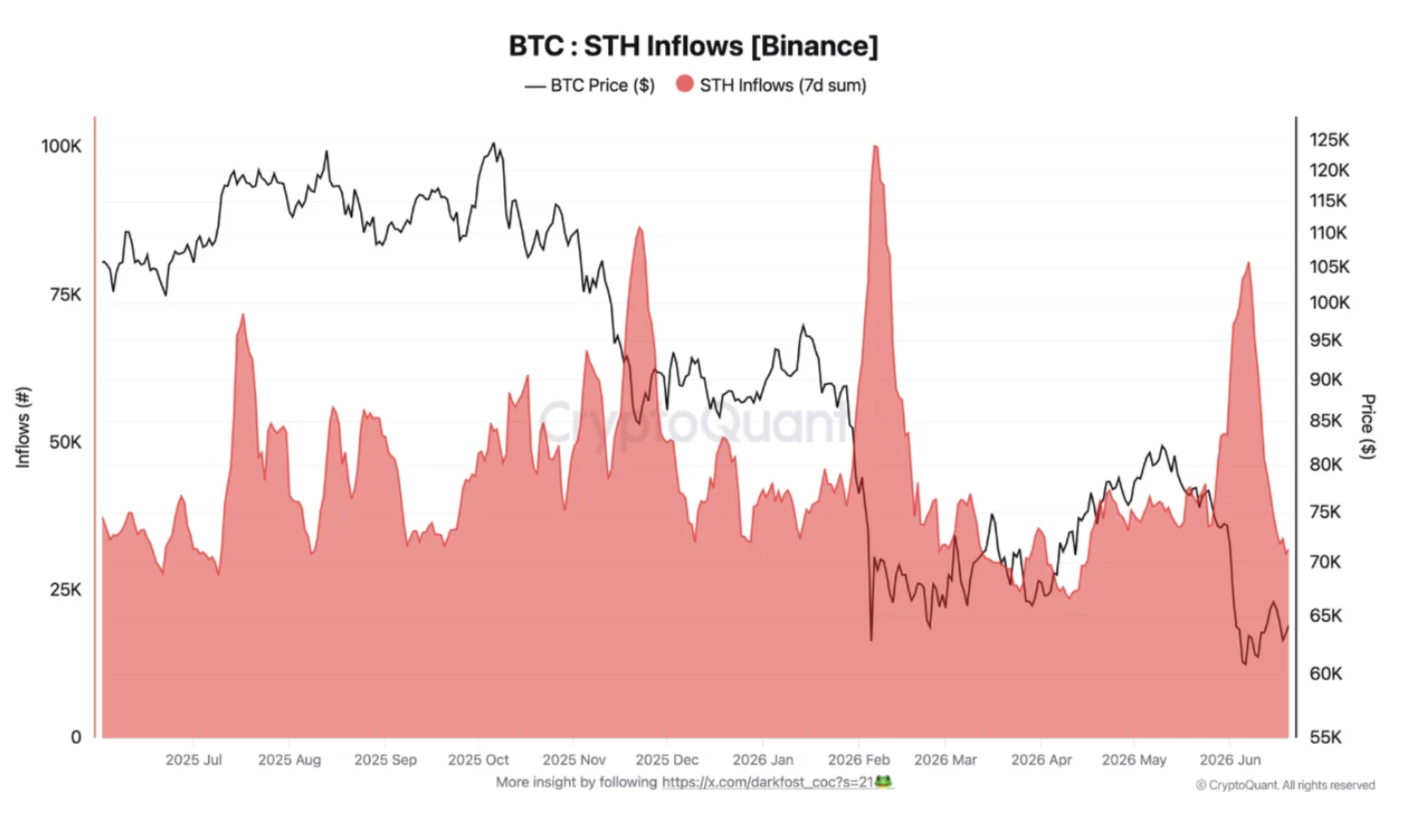
Bitcoin short-term holder inflows (screenshot). Source: CryptoQuant
The selling has yet to significantly influence the behavior of large-volume investors, who remain unfazed at current price levels. CryptoQuant contributor CryptoZeno examined the profitability of both older and newer Bitcoin whales and suggested the market has reached a state of balance.
“The divergence between long-term and short-term whale profitability signals a market in the process of consolidating rather than capitulating,” they summarized.
“Long-term whales are holding onto their positions despite diminished gains, while short-term whales remain mostly neutral. This dynamic typically reflects a period of market stabilization in which speculative excess is being steadily flushed out.”
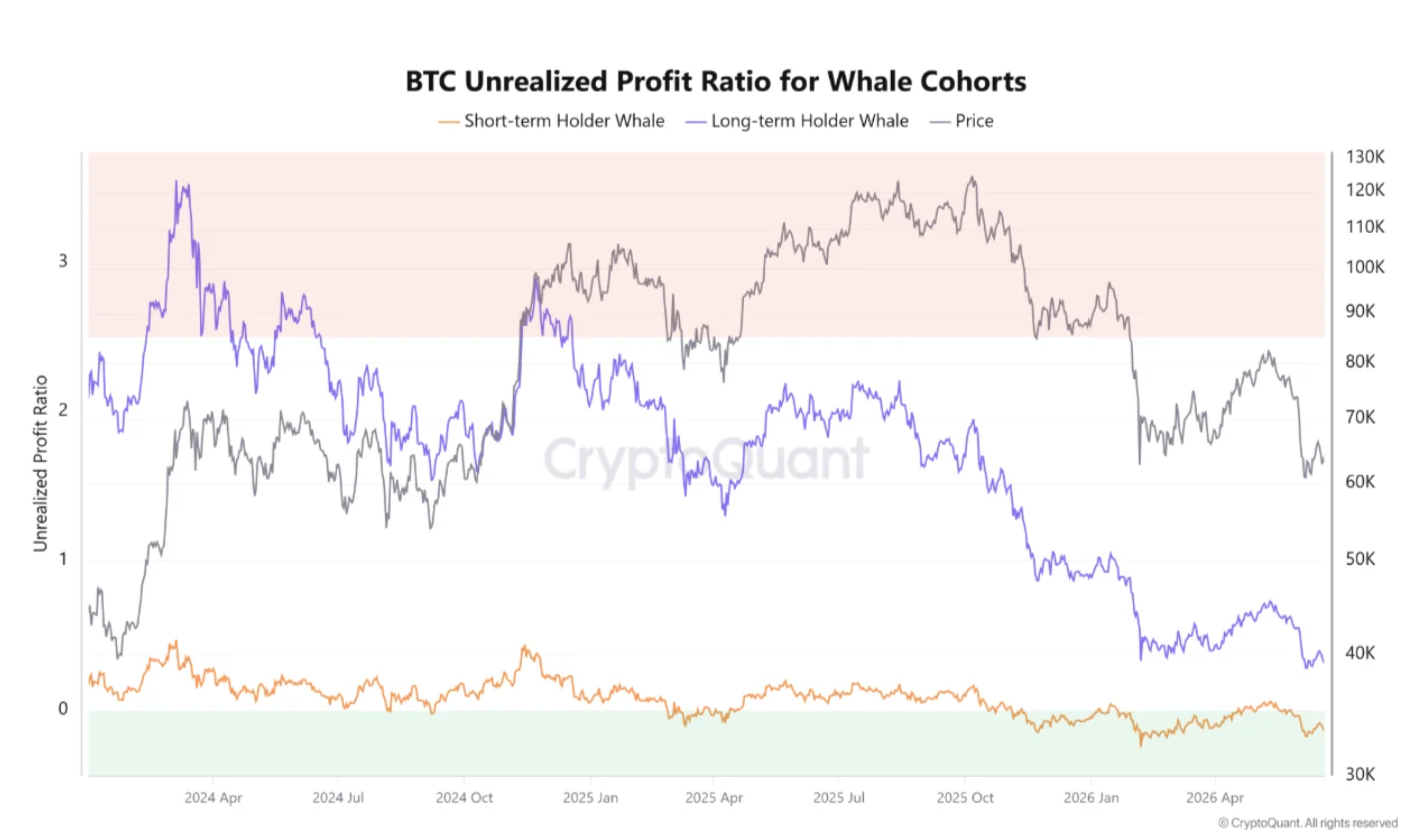
Bitcoin whale unrealized profit ratio (screenshot). Source: CryptoQuant