


Key takeaways:
- Bitcoin has dropped to around $76,000, a key short-term support level worth monitoring.
- Several leading altcoins have fallen below their short-term support zones, suggesting bullish momentum has faded.
Bitcoin (BTC) faced selling pressure on Monday after US President Donald Trump issued a warning to Iran, stating that “time is running out” and urging swift action. Crypto analyst CryptoRover noted in an X post that a potential US military strike against Iran “poses a serious threat to $BTC.”
Institutional investors also appear to be adopting a more cautious stance in the near term. SoSoValue data shows that spot Bitcoin exchange-traded funds saw $1 billion in net outflows over the past week. This marked the first week of net outflows following six consecutive weeks of inflows amounting to $3.4 billion.
Daily crypto market overview. Source: TradingView
While many traders remain wary of BTC’s short-term outlook, Michael Saylor’s Strategy — the world’s largest publicly traded Bitcoin holder — kept accumulating. Strategy acquired 24,869 Bitcoin for $2.01 billion between May 11 and 17, raising its total holdings to 843,738 BTC, according to Monday’s 8-K filing with the US Securities and Exchange Commission.
Can BTC and the major altcoins recover from their critical support levels? Let’s examine the charts of the top 10 cryptocurrencies to assess the possibilities.
S&P 500 Index price outlook
The S&P 500 Index (SPX) climbed to a fresh all-time high of 7,517 on Thursday, where short-term traders locked in gains.
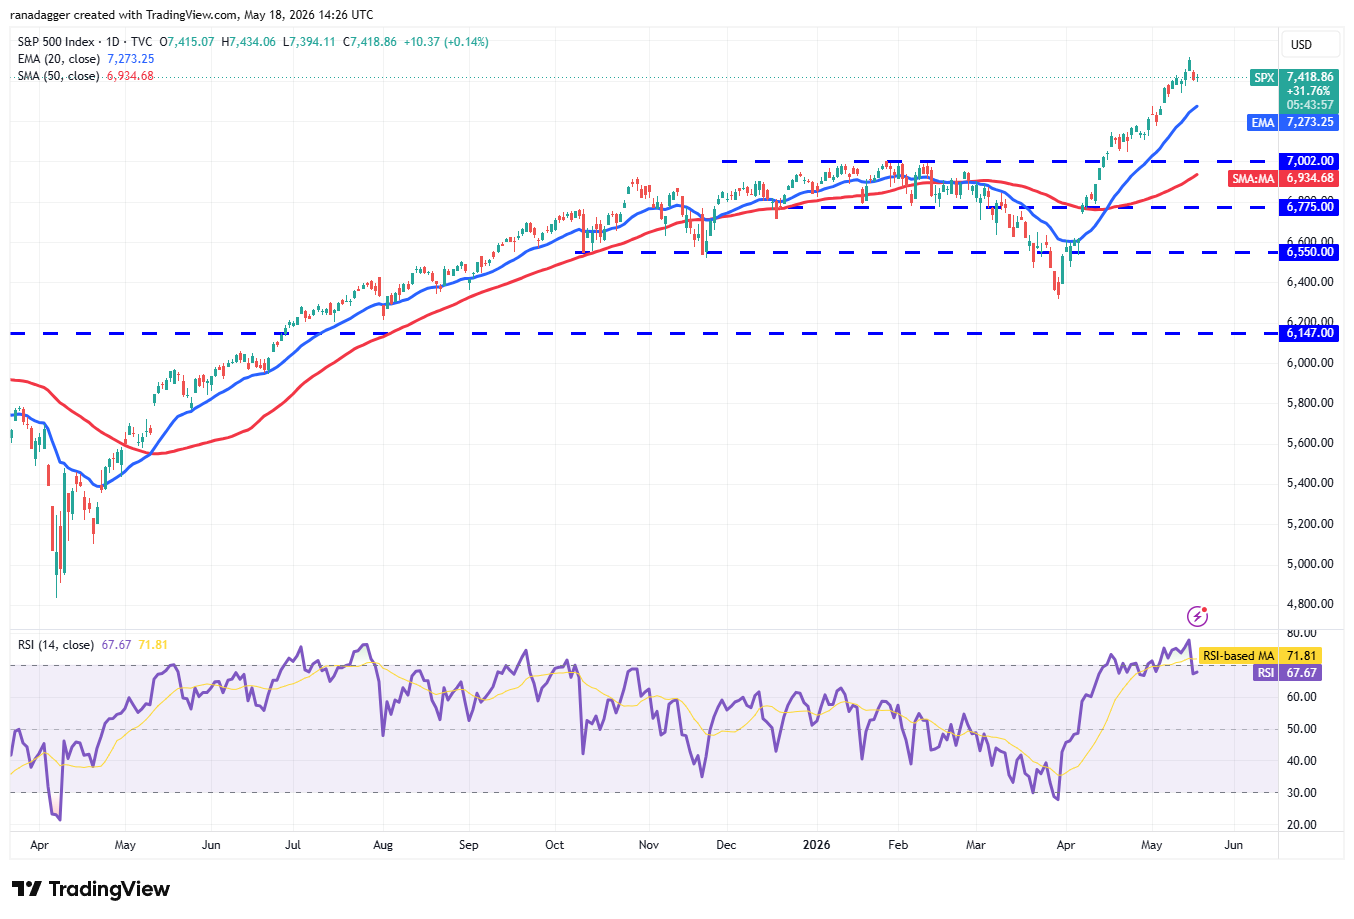
SPX daily chart. Source: Cointelegraph/TradingView
The index could pull back toward the 20-day exponential moving average (7,273), an important support level to keep an eye on. A strong bounce off the 20-day EMA would point to positive market sentiment, raising the chances of the uptrend resuming toward the 8,000 mark.
Sellers would need to push the price below the 20-day EMA to weaken the bullish momentum. If that happens, the index could see a deeper correction toward the 7,002 level.
US Dollar Index price outlook
The US Dollar Index (DXY) bounced off the 97.74 support and moved above the moving averages.
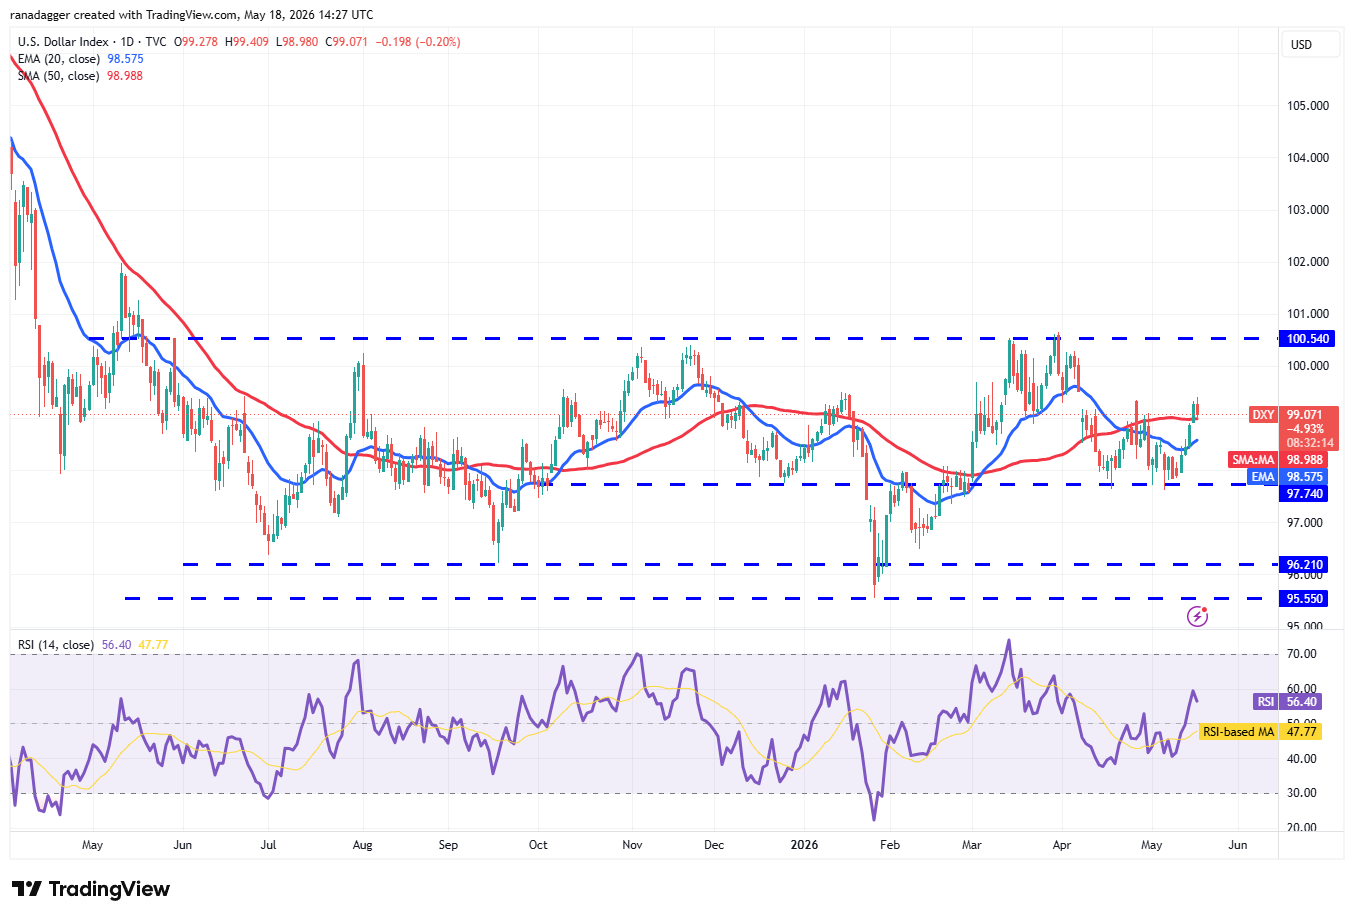
DXY daily chart. Source: Cointelegraph/TradingView
There is modest resistance at 99.34, but if bulls manage to hold the price above it, the index could advance toward the strong overhead resistance at 100.54. Sellers are likely to mount a fierce defense at the 100.54 level, since a break and close above it would signal the beginning of a new uptrend. The index could then rally to 101.97.
On the other hand, if the price reverses lower from the current level or from the 100.54 resistance and drops below the 50-day simple moving average (98.98), it would suggest that bears continue to be active at higher levels. This could keep the index trapped in a range between 97.74 and 100.54 for several more days.
Bitcoin price outlook
BTC extended its decline and has reached the 50-day SMA ($75,627), indicating that bears are trying to seize control.
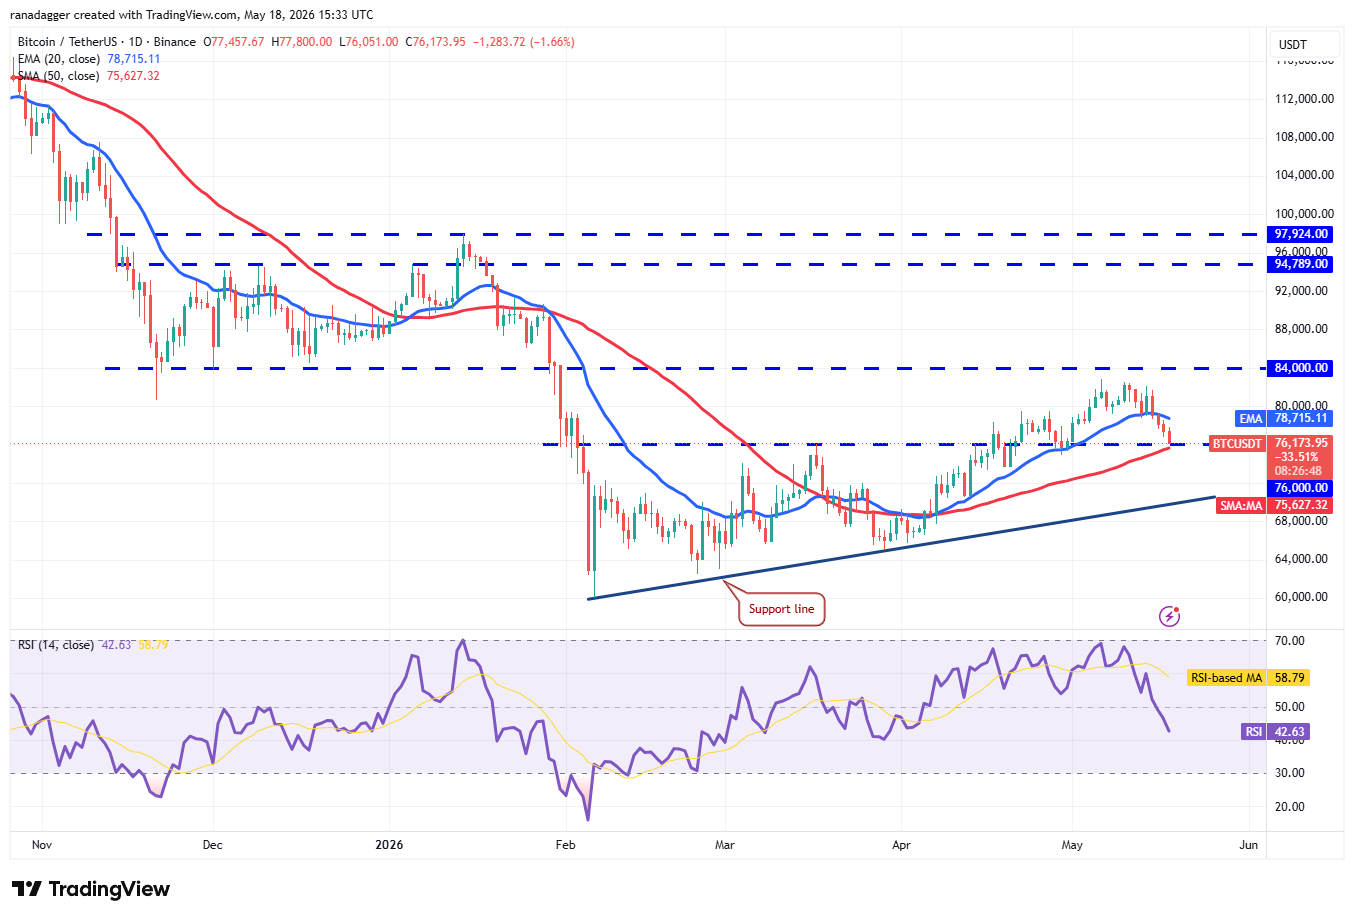
BTC/USDT daily chart. Source: Cointelegraph/TradingView
Buyers will need to keep the BTC price above the 50-day SMA to maintain the advantage. The first sign of strength would be a close above the 20-day EMA ($78,715). That would pave the way for a rally toward the $84,000 resistance.
Alternatively, if the price closes below the 50-day SMA, it raises the risk of a decline to the support line of the ascending channel pattern. Buyers are expected to aggressively defend the support line, as a break below it could send the BTC/USDT pair tumbling to $65,000.
Ether price outlook
Ether (ETH) continued its descent and closed below the support line of the ascending channel pattern on Sunday.
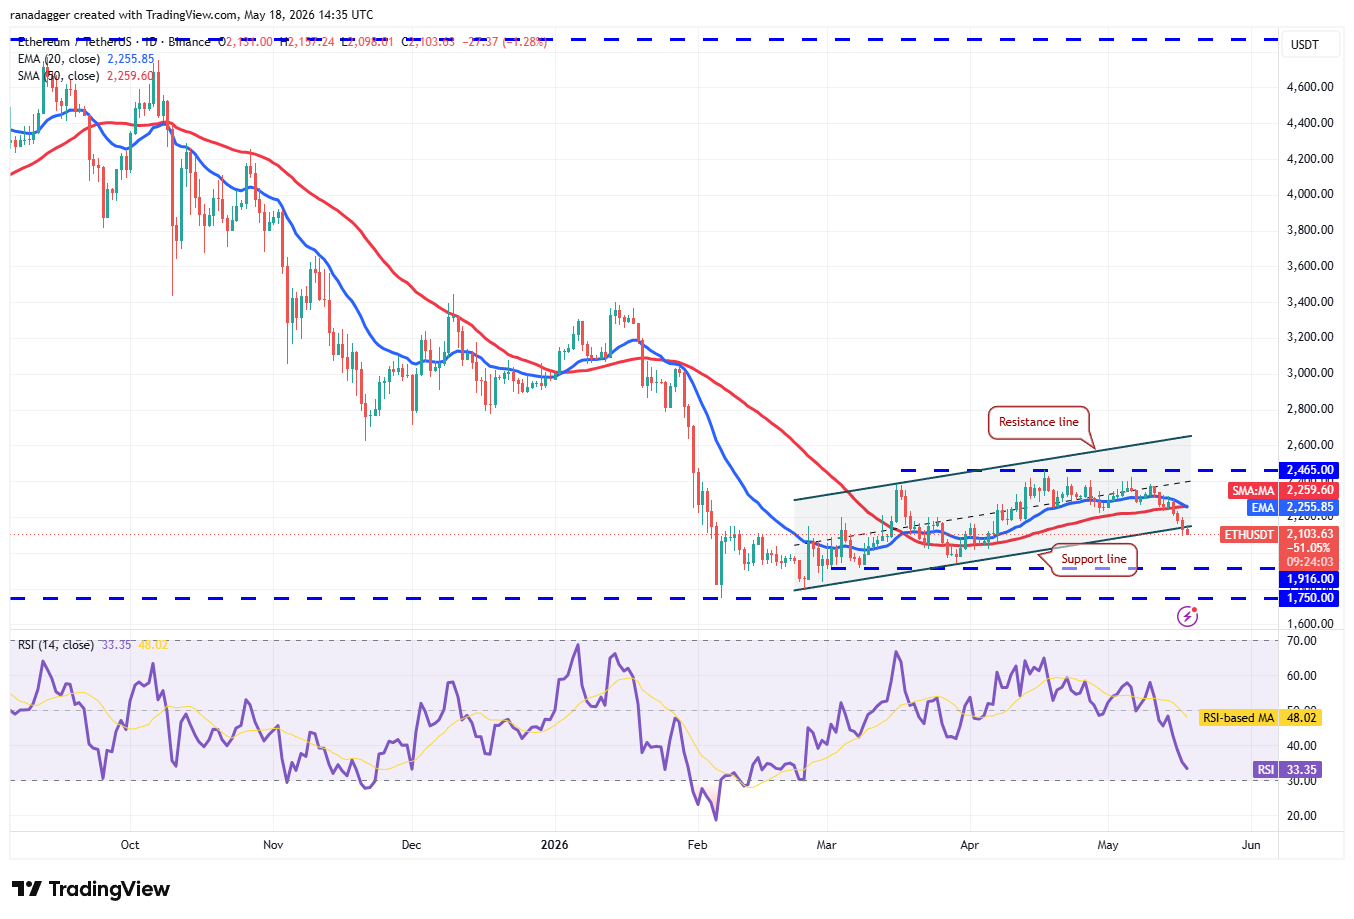
ETH/USDT daily chart. Source: Cointelegraph/TradingView
The 20-day EMA ($2,255) has started to slope downward, and the RSI is approaching oversold territory, signaling that bears are in command. Any attempt at recovery is likely to encounter selling pressure at the 20-day EMA. If the ETH price drops sharply from the 20-day EMA, the probability of a fall to $1,916 rises.
Buyers face a tough challenge ahead. They will need to push and hold the ETH/USDT pair above the moving averages to signal a potential reversal.
XRP price outlook
XRP (XRP) has fallen below the 50-day SMA ($1.39), suggesting that bears are trying to take the upper hand.
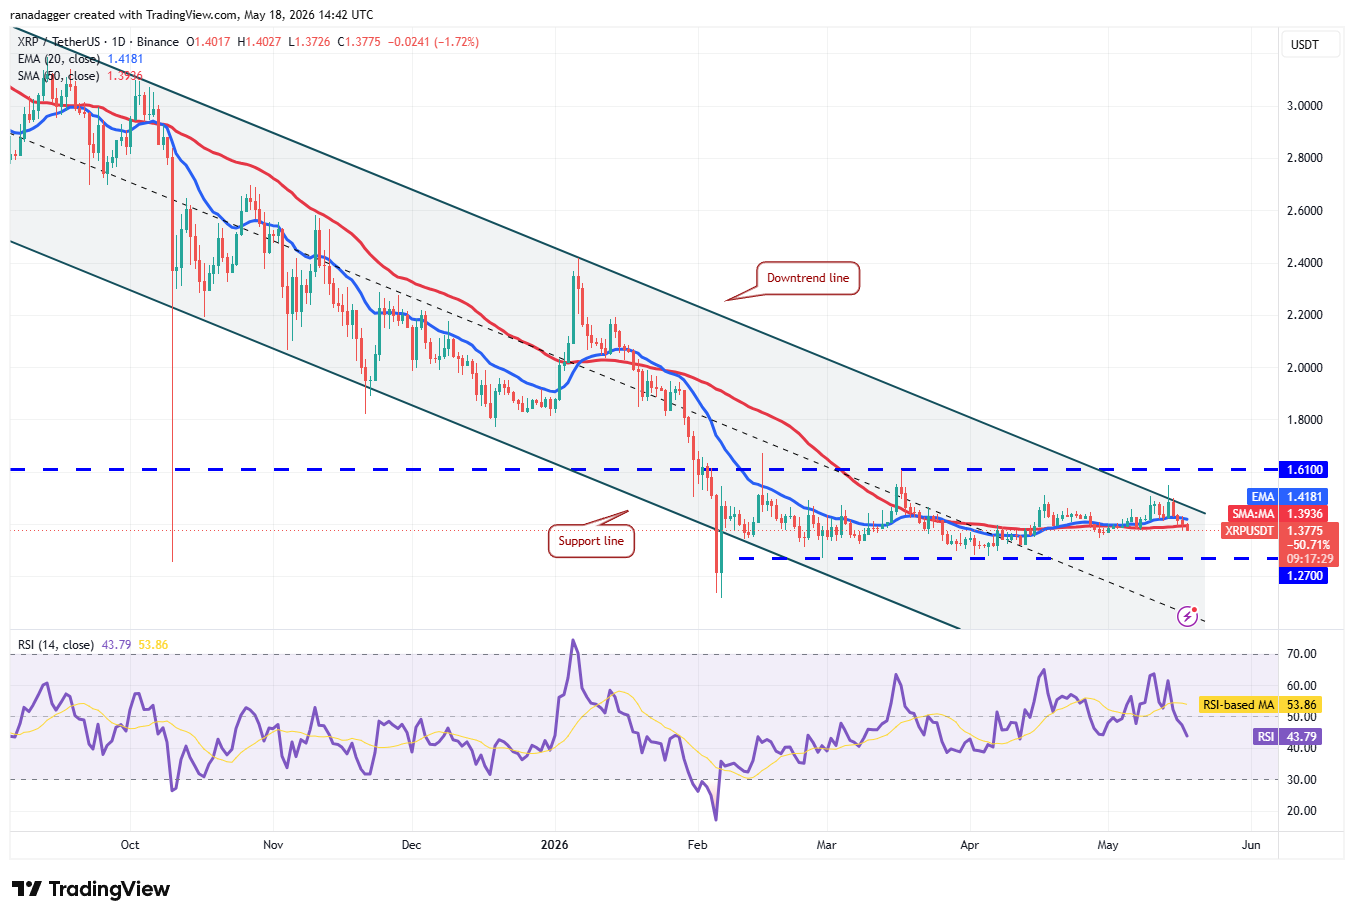
XRP/USDT daily chart. Source: Cointelegraph/TradingView
If the price closes below the 50-day SMA, the next likely target is the strong support at $1.27. Buyers are expected to defend the $1.27 level vigorously, as a close below it could drag the XRP/USDT pair down to $1.11 and eventually to the psychological $1 mark.
Buyers are likely to encounter selling pressure at the downtrend line and then at the $1.61 level. A break and close above the $1.61 resistance would signal a short-term trend reversal. The XRP price could then advance to $2 and subsequently to $2.40.
BNB price outlook
BNB (BNB) retreated from the $687 overhead resistance and dropped below the 20-day EMA ($648).
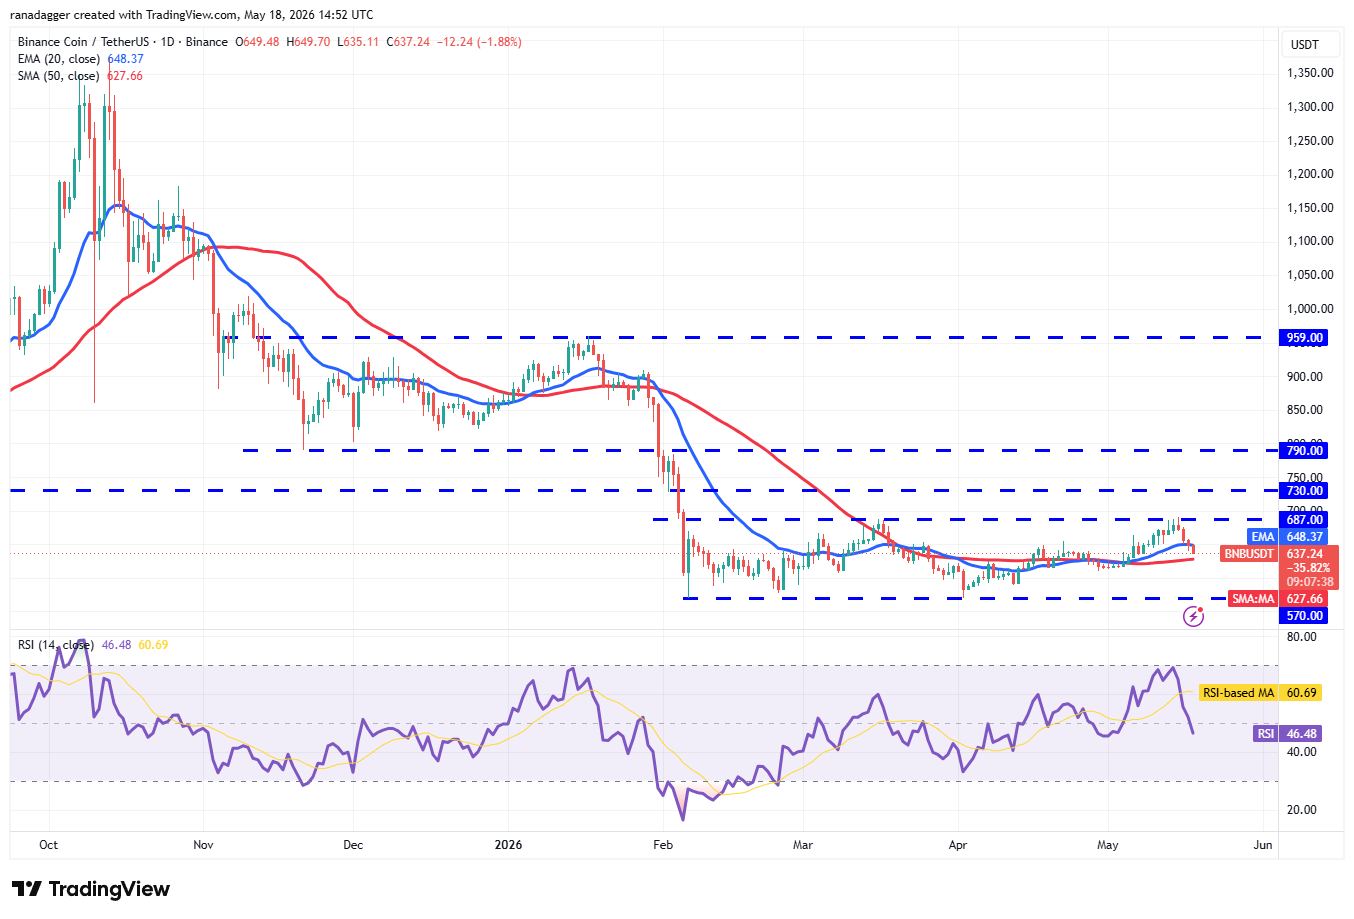
BNB/USDT daily chart. Source: Cointelegraph/TradingView
There is modest support at the 50-day SMA ($637), but if that level gives way, the BNB/USDT pair could plunge to the strong support at $570. This is a critical level to watch, as a close below $570 would mark the start of the next phase of the downtrend. The pair could then tumble toward $500.
On the flip side,
If the BNB price bounces off the 50-day SMA, it signals strong demand at lower levels. Buyers will need to push the price above the $687 resistance to confirm strength. The pair could then rally toward $730 and eventually reach $790.
Solana price prediction
Solana (SOL) closed below the 50-day SMA ($85) on Sunday, suggesting that sellers are regaining control.
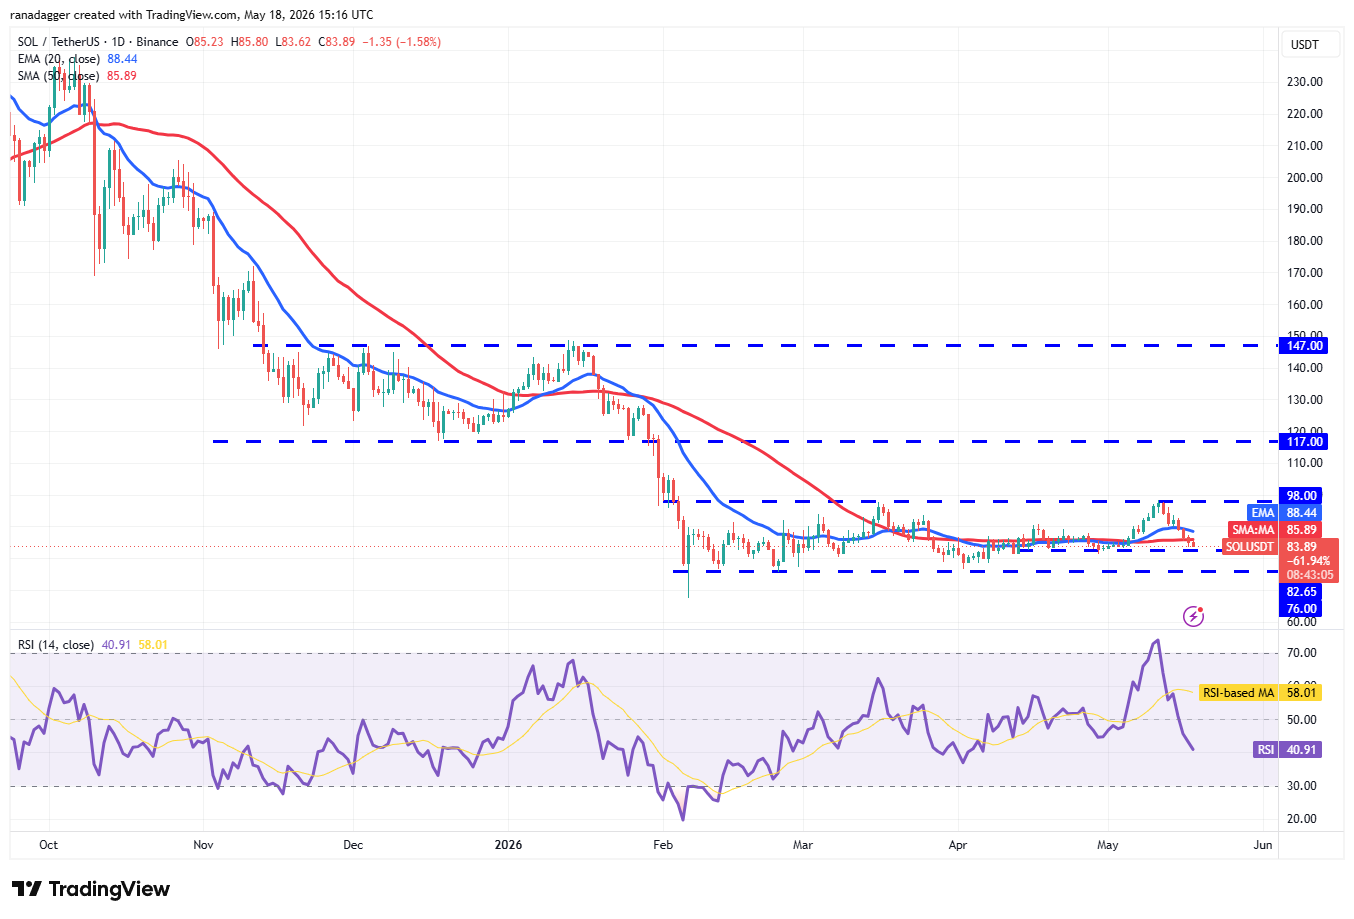
SOL/USDT daily chart. Source: Cointelegraph/TradingView
There is support at $82, but any recovery is likely to face selling pressure at the 20-day EMA ($88). If the SOL price drops sharply from the 20-day EMA, the chances of a breakdown below the $82 support increase. That would open the door for a decline to the $76 level.
The first sign of strength will be a close above the 20-day EMA. That would demonstrate solid buying interest at lower levels. The bulls will regain control once the SOL/USDT pair closes above the $98 resistance.
Related: Hyperliquid eyes 55% price rise after Silicon Valley investor’s ‘massive HYPE buy’
Dogecoin price prediction
Dogecoin (DOGE) has fallen below its 20-day EMA ($0.11), indicating that buyers have stepped back in the short term.
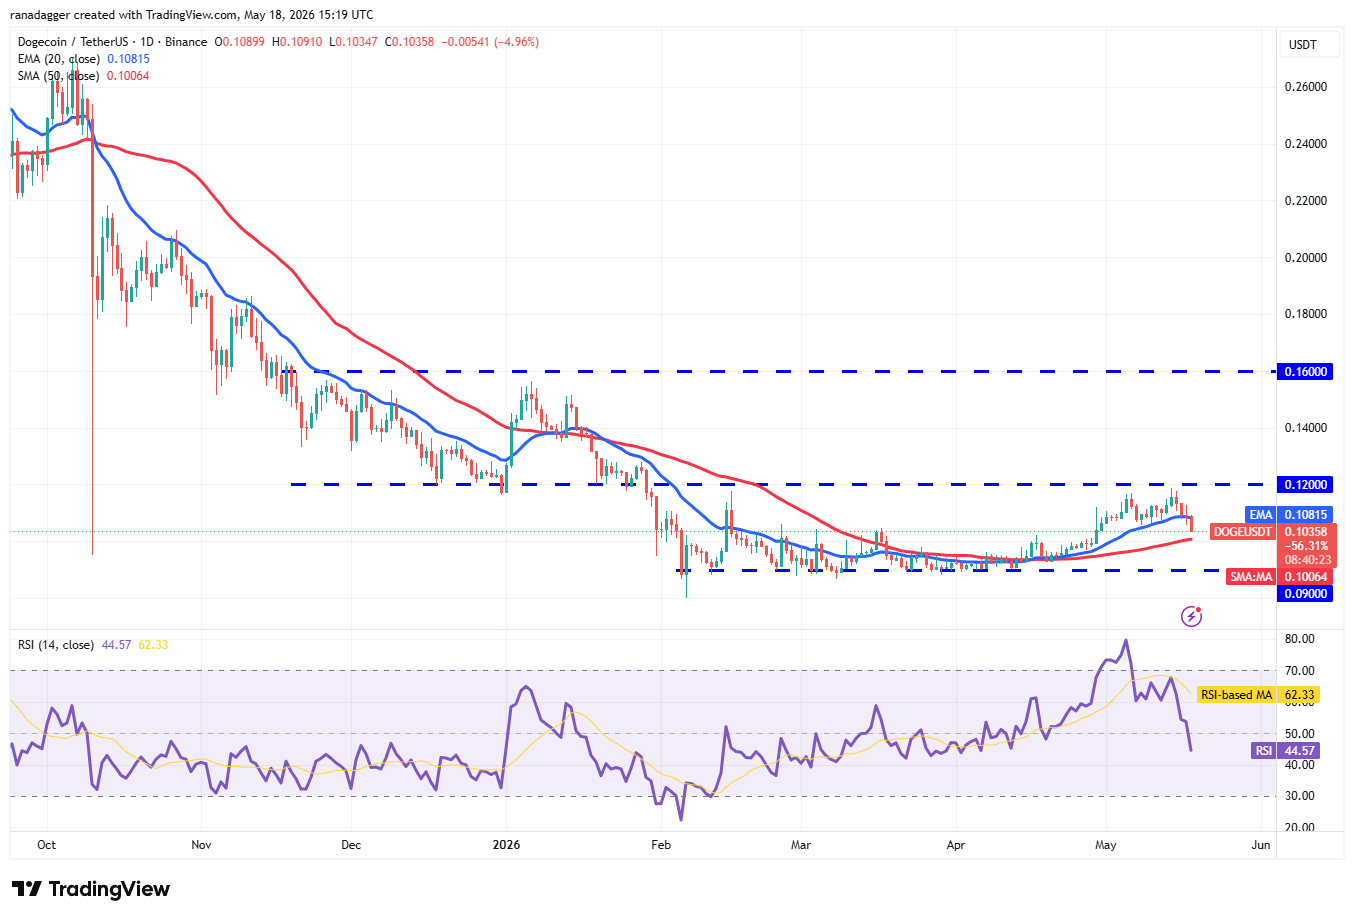
DOGE/USDT daily chart. Source: Cointelegraph/TradingView
The flat 20-day EMA and the RSI hovering just below the midpoint suggest the pair may continue to trade in a range between $0.09 and $0.12 for some time.
Buyers will need to push and hold the DOGE price above the $0.12 resistance to signal the start of a new upward move. The DOGE/USDT pair could then climb to $0.14 and later reach $0.16.
On the downside, a break and close below the $0.09 support would indicate the downtrend has resumed. The pair may then drop to $0.08.
Hyperliquid price prediction
Hyperliquid (HYPE) has been highly volatile in recent days, reflecting an intense battle between buyers and sellers.
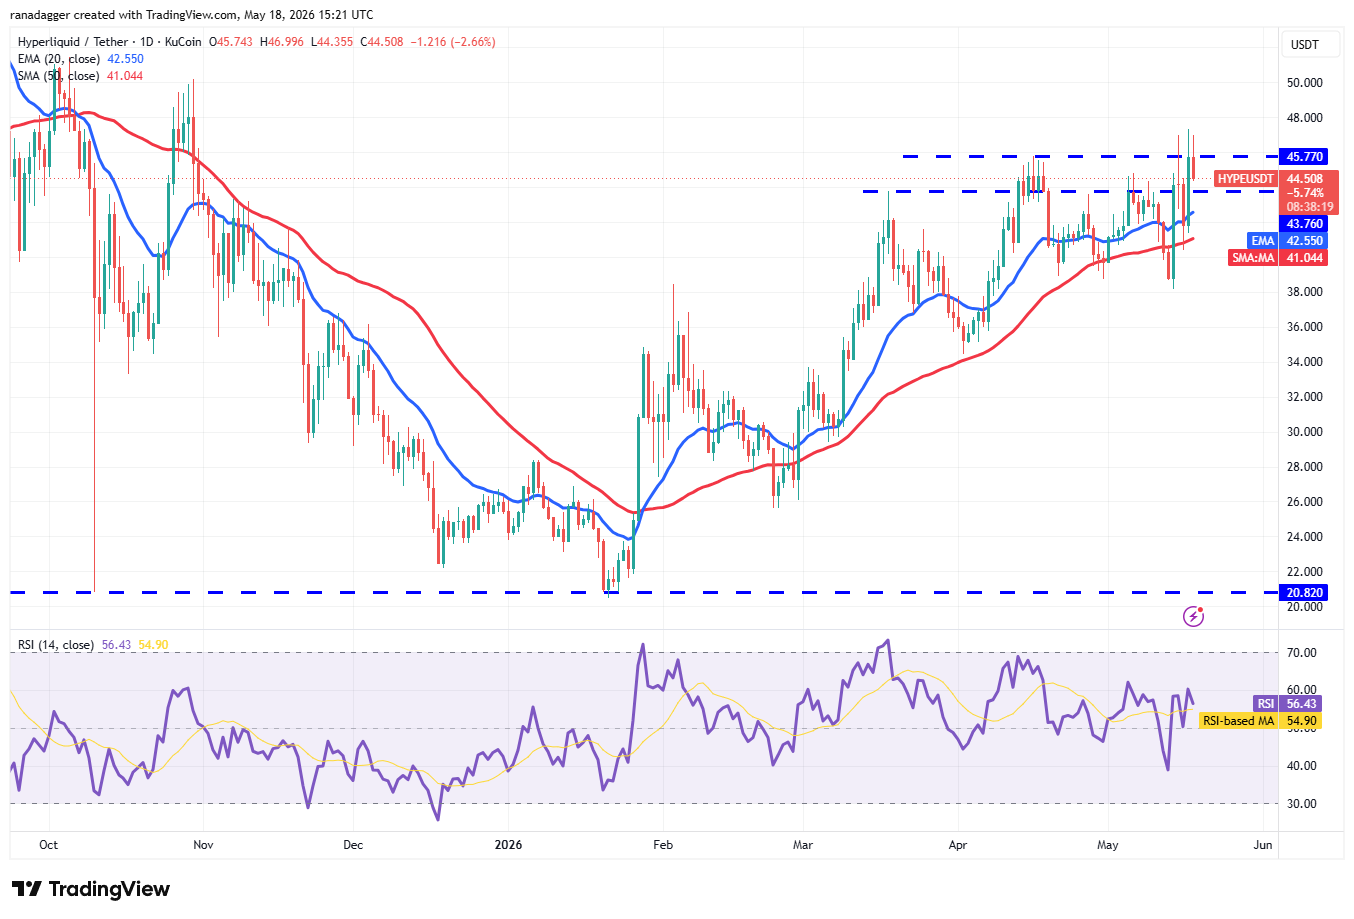
HYPE/USDT daily chart. Source: Cointelegraph/TradingView
The bulls pushed the HYPE price above the $45.77 resistance, but the long wick on the candlestick shows selling at higher levels. Buyers will need to secure a close above the $45.77 level to clear the way for a rally toward the $50 to $51.43 zone.
The 20-day EMA ($42.55) is the key support to watch on the downside. A break below it suggests the HYPE/USDT pair may consolidate within the $38.17 to $47.32 range for a while.
Cardano price prediction
Cardano (ADA) has dropped below the 50-day SMA ($0.25), indicating that sellers continue to dominate.
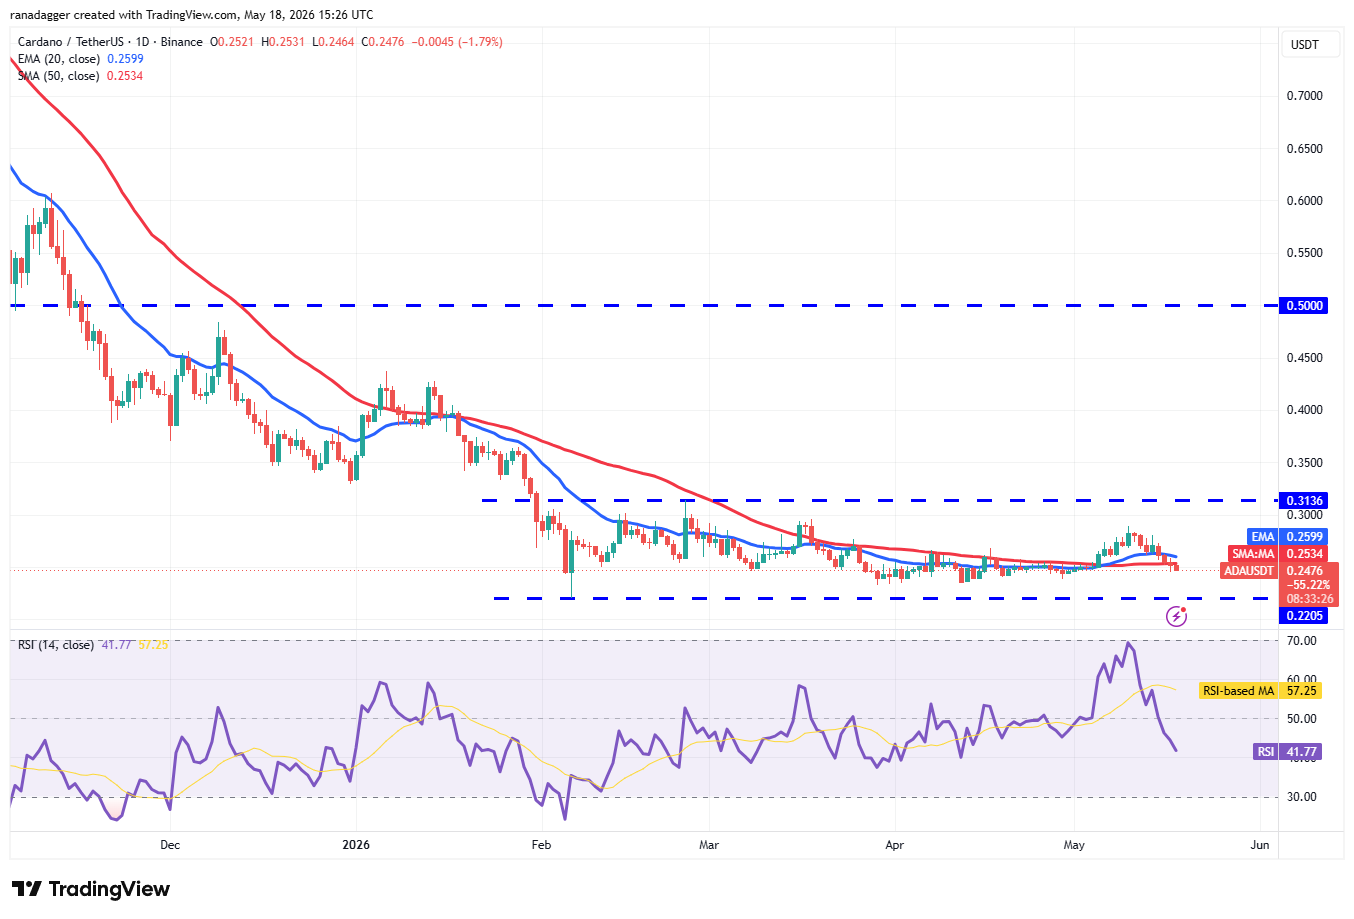
ADA/USDT daily chart. Source: Cointelegraph/TradingView
The flat moving averages and the RSI just below the midpoint suggest the ADA/USDT pair may continue to trade within the $0.22 to $0.31 range for a few more days.
The next directional move may begin on a close above the $0.31 resistance or below the $0.22 support. If the ADA price bounces and breaks above $0.31, the pair could gain momentum and rally toward $0.40. Alternatively, a close below $0.22 would signal the downtrend has resumed, with a target of $0.13.