



# Bringing Bitcoin to Life: The Art and Science of Blockchain Visualization
## Introduction
Bitcoin exists in a purely digital realm, which can make it feel intangible for everyday people. Over the years, a creative community of developers, artists, and enthusiasts has bridged that gap by building visual tools that transform raw blockchain data into something you can see, hear, and even interact with. From floating 3D galaxies to ambient soundtracks that ebb and flow with transaction activity, these tools turn the Bitcoin network into a living, breathing experience.
Whether you want to decorate your office, better understand on-chain activity, or even build your own visualization, the world of Bitcoin visualizers offers something for everyone. Here is a look at the most compelling projects turning blockchain data into art.
—
## Block Explorers Reimagined
Block explorers are the backbone of Bitcoin transparency. They allow anyone to verify transactions, check confirmation statuses, and understand fee markets. But several projects have taken this concept far beyond a simple search bar, turning data retrieval into an immersive experience.
### Mempool.space
Mempool.space has become one of the most visited destinations in the Bitcoin ecosystem. It offers a clean, real-time view of transaction flows, fee estimates, and the contents of the next block before it is mined. One standout feature is its open-source backend, meaning users who run their own full nodes can deploy a local instance that reflects their personal view of the network — including their own mempool. It is both a practical tool and a visual window into how Bitcoin processes payments globally.
### ExploreTimeChain.com
For those who want a more cinematic experience, ExploreTimeChain.com replaces the standard dashboard with a space exploration interface. Transaction IDs and public addresses serve as launch coordinates. Once inside, each transaction appears as a meteor drifting through block space, and users can manually pilot a ship through this digital cosmos. The site also renders the blockchain itself as a 3D chain, giving a literal spatial dimension to what is otherwise an abstract sequence of data.
### Symphony by IOHK
Symphony takes exploration a step further by adding sound to the mix. Users navigate the blockchain through a 3D environment accompanied by a synthetic orchestra that shifts based on network activity. Built with gaming-style controls and VR compatibility, Symphony turns block exploration into an almost otherworldly journey — imagine flying through the Milky Way while hearing the rhythm of Bitcoin transactions unfold around you.
### The Anatomy of Bitcoin
Created by Pedro, this project is as much a data science endeavor as it is a visual art piece. The backend is MIT-licensed and open source, offering 3D modeling of Bitcoin at nearly every layer: from the individual bits of a private key to the dynamic state of the UTXO set, and all the way up to node network topology. While its block explorer functionality is somewhat hidden within menus, the sheer ambition of modeling the entire system in three dimensions makes this project a standout in the Bitcoin creative ecosystem.
—
## Mempool Visualizers: Seeing the Flow
Not all visualization tools focus on individual transactions. Some are designed to give a broader, more atmospheric sense of what is happening on the network at any given moment.
### Mempool.JHoenicke.de
Dr. Jochen Hoenicke has maintained his mempool data site for over a decade, creating one of the longest-running historical datasets in Bitcoin. His graphs and charts are invaluable for researchers tracking congestion patterns over time. The site helps users estimate how much they should pay for on-chain transactions by showing how full or empty the next block is likely to be. It is minimal in design but unmatched in utility for anyone serious about understanding Bitcoin’s transaction market.
### GetNotZero.com
This dashboard blends real-time data with a cypherpunk aesthetic, featuring an orange-themed interface that displays hash rate estimates, mining difficulty, mempool projections, and the ETA until the next halving. Beyond its visual appeal, GetNotZero encourages home mining by reminding visitors that solo mining a block — while statistically unlikely — could yield 3.125 BTC directly into a self-hosted wallet with no KYC. It is equal parts data display and motivational poster for Bitcoin maximalists.
### TxCity.io
TxCity.io takes a playful approach by pitting the Bitcoin and Ethereum mempools against each other in a South Park-inspired bus stop metaphor. Transactions of different types queue up as characters waiting for their bus — which is, of course, the next block. The site is aware of SegWit transactions and covers a range of legacy cryptocurrencies, making it an entertaining way to compare network activity across chains.
—
## Musical Mempools: Listening to the Network
Some creators have abandoned visuals entirely in favor of sound, translating on-chain events into ambient music that can fill a room.
### Proof of Sound
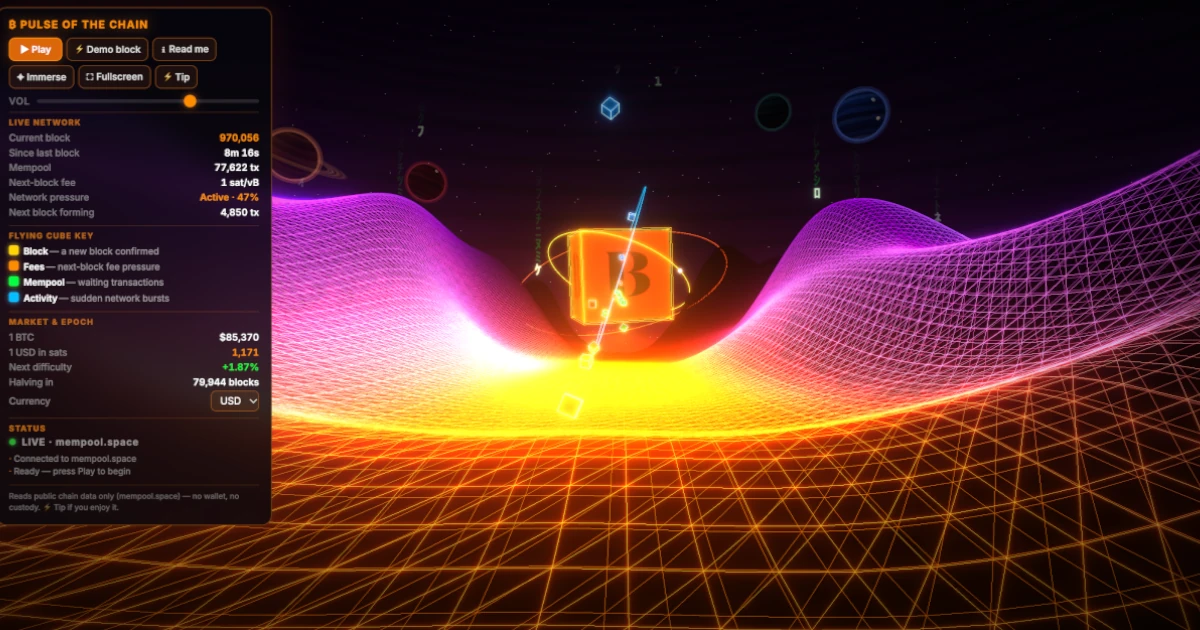
Proof of Sound assigns musical notes to different transaction types and mempool events. When a new block is found, it triggers its own unique sound. The result is a synthwave 3D animation that doubles as both decoration and a real-time audio feed of network activity. Users can toggle sound on and off and adjust various parameters to customize the experience.
### Bitlisten
Bitlisten takes a stripped-down approach. Each transaction in the mempool produces a bell sound whose pitch and rhythm depend on the transaction’s size. The default instrument is a celesta, though users can switch to other sounds for a different tonal palette. While its visual design is modest, the auditory experience is genuinely soothing — ideal as background ambiance while working or relaxing.
### Phenomenal Gumption
This anonymous Netlify-hosted app offers a more curated musical experience. While it reacts to on-chain events visually with expressive synth waves, the underlying music is professionally produced rather than generated in real time. Every moment is claimed to be unique, making it a polished alternative for those who want the aesthetic of a live data feed with a more refined soundtrack.
### OmPool
OmPool is designed specifically for the Omarchy OS, a Linux-based operating system favored by users looking to escape mainstream desktop environments. It functions as a panel widget that runs in the background, pairing beautiful UI design with gentle sound patterns derived from mempool activity. Its open-source nature and integration with a privacy-focused operating system make it a natural fit for the cypherpunk community.
—
## FAQ
**What is a Bitcoin block explorer?**
A block explorer is a web-based tool that allows users to search and view data from the Bitcoin blockchain, including individual transactions, block contents, wallet balances, and fee information.
**Can I run these visualizers on my own computer?**
Some of these projects, like Mempool.space and The Anatomy of Bitcoin, offer open-source backends that can be run locally if you have your own full node. Others are hosted online and simply require a web browser.
**Do these tools require any coding knowledge to use?**
Most are designed for casual browsing and require no technical skills. However, if you want to self-host or modify them, familiarity with web development and Bitcoin node software is helpful.
**Are these visualizers connected to the actual Bitcoin network?**
Yes. The reputable projects listed here are synced to the live Bitcoin network, meaning the data and visuals you see reflect real, ongoing activity on the blockchain.
**What is the mempool?**
The mempool (memory pool) is the collection of all unconfirmed transactions waiting to be included in the next block. Visualizing the mempool helps users understand network congestion and estimate appropriate transaction fees.
**Can I build my own Bitcoin visualizer?**
Absolutely. Many of the projects mentioned are open source, and the rise of “vibe coding” has made it easier than ever for hobbyists to create their own data visualizations with minimal setup.
—
## Conclusion
Bitcoin visualization has evolved from simple data tables into a rich ecosystem of art, music, and interactive design. These tools serve a dual purpose: they make the inner workings of the Bitcoin network accessible and beautiful while providing genuine utility for understanding transaction flows, fee markets, and network health. Whether you are a developer looking for inspiration, a Bitcoin enthusiast wanting a unique desktop companion, or simply someone curious about what happens beneath the surface of every transaction, these visualizers offer a fascinating lens into the world’s most enduring digital monetary system.
Thank you for reading
