



# A Deep Learning Framework for Discovering Spatial Patterns Linked to Clinical Outcomes in Tissue Samples
## Introduction
Spatial biology has transformed our understanding of tissue architecture by revealing how cells organize themselves in their native environments and how these organizations relate to disease progression. Recent advances in imaging mass cytometry and multiplexed tissue profiling now allow researchers to measure protein abundance at single-cell resolution across entire tissue sections, generating rich, spatially resolved datasets. However, extracting clinically meaningful insights from such complex data remains a significant challenge. A novel computational framework called SpaCEy was developed to address this gap by combining graph-based representations of tissue architecture with explainable machine learning to identify spatially localized molecular patterns that predict patient outcomes.
## Building a Spatial Graph from Tissue Data
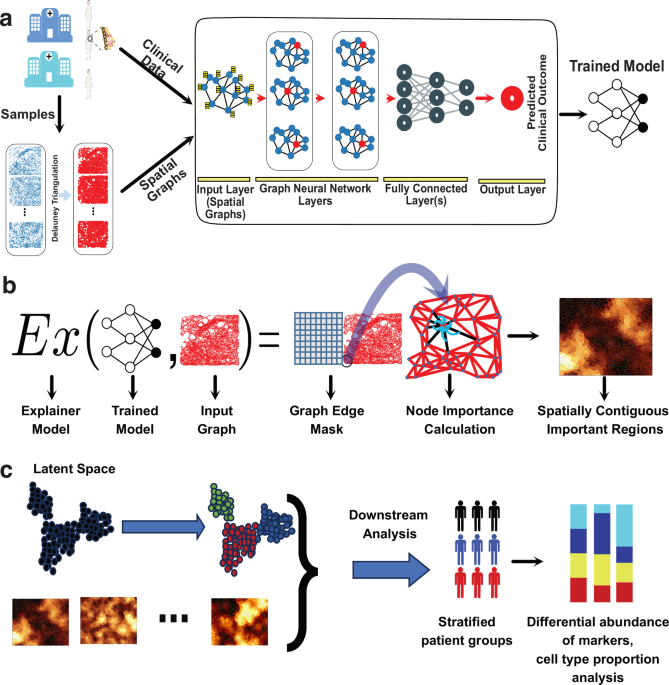
The framework begins by converting spatially resolved tissue samples into graph structures. Each individual cell within a tissue section is represented as a node in the graph, with its features corresponding to the measured abundance of each protein marker in that specific spatial location. To preserve the native tissue architecture, cells are connected to their nearest spatial neighbors using a Delaunay triangulation approach. This method ensures that the resulting graph faithfully reflects the physical adjacency relationships between cells as they exist in the tissue section.
Importantly, cell-type and compartment annotations are not used as input features for the model. Instead, these annotations are retained as metadata for post hoc biological interpretation, allowing the model to learn purely from the protein abundance measurements and spatial connectivity. Clinical outcome labels—such as disease progression status or overall survival time—serve as the supervised targets during training, while clinical annotations like subtype or stage are reserved exclusively for descriptive purposes after the model has been trained.
## Graph Neural Network Architecture and Training
Once the spatial graphs have been constructed, a graph neural network (GNN) is trained to learn latent representations of each sample. The GNN leverages the connectivity structure of the spatial graph, allowing information to propagate between neighboring cells. This design enables the model to capture both the molecular profile of individual cells and the spatial context in which those cells reside, producing embeddings that encode tissue-level patterns relevant to the clinical outcome of interest.
The model was trained and evaluated on multiple independent cohorts spanning different cancer types, including lung adenocarcinoma and breast cancer, using imaging mass cytometry data. Training settings were carefully optimized, and cross-validation protocols were designed to prevent data leakage—for instance, patient-level stratified splits were used consistently throughout all benchmarking experiments.
## Interpreting the Model with an Explainable AI Component
A key innovation of the framework lies in its ability to generate interpretable, spatially contiguous regions within the tissue that are most influential for the model’s predictions. After training the GNN, an explainer model is applied to the same spatial graph. The explainer produces two types of importance maps: edge masks that highlight the most significant connections between cells, and node importance scores that identify individual cells contributing most strongly to the prediction.
Node importance is computed by aggregating edge-mask values across the k-hop neighborhood of each node. This aggregation step is critical because it allows the framework to identify compact, connected subgraphs—spatially contiguous tissue regions—rather than isolated individual cells. These regions represent localized molecular drivers of clinical outcomes, providing a data-driven lens through which to examine the tumor microenvironment.
It is important to note that the importance values are unsigned; they quantify the magnitude of relevance but do not inherently encode the direction of effect. In other words, the framework identifies which graph components are most influential for the prediction, but additional downstream analysis is required to determine whether a given molecular signal is associated with favorable or unfavorable outcomes.
## Discovering Progression-Associated Patterns in Lung Adenocarcinoma
The framework was first applied to a lung adenocarcinoma dataset comprising samples from 416 patients, where the task was to predict disease progression as a binary classification problem. Analysis of the learned embeddings revealed a clear association between the latent representations and clinical progression status. When samples were visualized in a reduced-dimensional space, progressor and non-progressor patients occupied distinguishable regions, despite the Kaplan-Meier survival curves not showing a statistically significant difference between the two groups.
Differential abundance analysis of the explainer-identified important nodes uncovered distinct immune microenvironments between the two groups. Progressing tumors showed enrichment of FOXP3-positive regulatory T cells and CD163-positive macrophages—both markers previously linked to immunosuppressive tumor architectures and aggressive disease. In contrast, non-progressing tumors displayed higher levels of HLA-DR-positive antigen-presenting cells and CD4-positive T cells, suggesting an active anti-tumor immune response. Additionally, the framework identified a previously undescribed enrichment of CD163-negative macrophages in regions associated with progression, hinting at novel spatial immune dynamics that warrant further investigation.
Cell-type composition analysis further revealed that progressing tumors had significantly higher frequencies of macrophages, cancer cells, and endothelial cells within important regions. The co-localization of cancer and endothelial cells in these regions was visualized directly through graph edges connecting important cancer nodes to important endothelial nodes, providing image-level evidence of spatially organized cancer-endothelial interactions that may support metastatic potential.
When benchmarked against two state-of-the-art methods using five-fold cross-validation, the framework achieved the highest mean accuracy (0.68), F1-score (0.68), and area under the receiver operating characteristic curve (0.62), with notably stable performance across all folds. These results demonstrate both the predictive power and the robustness of the approach.
## Stratifying Breast Cancer Patients Through Subtype-Agnostic Spatial Patterns
The framework was then applied to a larger breast cancer cohort of 720 samples spanning multiple clinical subtypes and cancer stages. Survival prediction was formulated as a censoring-aware time-to-event task, appropriate for the clinical nature of the outcome. Kaplan-Meier analysis confirmed that clinical subtypes differed significantly in overall survival, with triple-negative breast cancer patients exhibiting the poorest outcomes.
Post hoc clustering of the learned sample embeddings revealed three subtype-agnostic patient groups with distinct survival distributions. One cluster was enriched for high-survival patients with a predominance of hormone receptor-positive, HER2-positive tumors, while another cluster was enriched for low-survival patients with a higher proportion of triple-negative cases. This clustering was performed without using clinical subtype labels, demonstrating that the spatial proteomic features alone could recapitulate clinically meaningful patient groupings.
Examination of differentially abundant proteins between the survival clusters identified several markers associated with poor prognosis. Slug, a transcription factor driving epithelial-to-mesenchymal transition, was elevated in lower-survival regions. Ki-67, a proliferation marker, and c-Myc, an oncogene regulating cell cycle progression, were similarly enriched. The co-occurrence of these markers suggests a tumor biology characterized by rapid proliferation and invasive behavior. Importantly, spatial visualization confirmed that these marker signals were not merely global tissue-wide changes but were organized within specific, model-selected tissue regions, underscoring the value of spatially resolved analysis.
Cell-type composition analysis showed that important nodes were distributed across tumor (55.2%), stroma (29.3%), immune (13.5%), and vascular (2.0%) compartments. This mixed composition indicates that the framework captures outcome-associated tissue structures spanning multiple biological contexts rather than being confined to a single compartment. Analysis of the stromal compartment specifically revealed that lower-survival samples had a smaller stromal fraction among important nodes, suggesting that stromal marker enrichment reflects specific molecular signals within heterogeneous tissue regions rather than simply a larger stromal area.
## Generalizing Across Independent Cohorts
To assess generalizability, the framework was trained independently on a second breast cancer dataset from the METABRIC cohort, comprising 460 samples from 405 patients. Similar survival-associated clustering patterns emerged, and the same markers linked to poor survival—including fibronectin, vimentin, and beta-catenin—were recapitulated. Importantly, the framework identified subtype-specific variations alongside shared patterns: fibronectin, for example, showed elevated abundance in the lower-survival group of the METABRIC cohort but was not specifically enriched in hormone receptor-positive patients relative to other subtypes within that dataset. This observation highlights that while the framework captures robust biological signals, individual markers should be interpreted in the context of each cohort’s composition.
Both datasets shared elevated expression of progesterone receptor in the higher-survival group and increased apoptotic markers—such as cleaved caspase and PARP—in favorable-outcome clusters. The consistency of these findings across independent cohorts reinforces the framework’s ability to identify biologically relevant, prognostic spatial patterns that generalize beyond any single dataset.
## The Advantage of Spatial Information for Prediction
A critical question in spatial biology is whether incorporating spatial context actually improves predictive performance compared to traditional approaches that aggregate molecular measurements without considering spatial relationships. To answer this, the framework was compared against four non-spatial baselines: Fast Survival SVM, Random Survival Forest, Gradient Boosting Survival Analysis, and Cox proportional hazards regression.
Non-spatial models were provided with pseudobulk protein abundance summaries and cell-type composition features aggregated using various functions (minimum, maximum, mean, and sum). After comprehensive hyperparameter optimization across 24 baseline configurations, the spatial framework significantly outperformed all alternatives. On the JacksonFischer breast cancer dataset, the framework achieved a mean concordance index of 0.720, representing a 16.5% relative improvement over the best non-spatial baseline (0.617). On the METABRIC dataset, the improvement was even more pronounced, with a 20.7% relative gain over the best baseline (0.688 versus 0.570). The framework also showed lower performance variability across folds, indicating more stable and reliable predictions.
A non-spatial multilayer perceptron baseline was also evaluated for its ability to stratify patients based on embedding-level clustering. Unlike the spatial framework, the non-spatial MLP did not produce significant survival separation in either dataset, reinforcing the conclusion that spatial context provides predictive information beyond what can be captured by aggregated molecular profiles alone.
## Learning from Multiplexed Imaging Data and Resisting Batch Effects
To evaluate performance under different imaging modalities, the framework was applied to a colorectal cancer dataset generated with CODEX technology, a multiplexed imaging platform. The task was to distinguish between Crohn’s-like reaction and diffuse inflammatory infiltration immune phenotypes using a supervised binary classification approach. SpaCEy achieved a held-out test AUPRC of 0.846, demonstrating that the framework can learn predictive spatial representations from CODEX data as well.
A particularly stringent test of robustness was conducted by evaluating batch sensitivity. Because each patient in the CODEX cohort was represented in two matched tissue microarray batches, the model was trained on samples from one batch and tested on held-out samples from a different batch. SpaCEy retained strong predictive performance in this cross-batch setting, achieving an AUPRC of 0.801. Visualization of the learned embeddings showed that samples clustered by immune phenotype rather than by technical batch, with a near-zero batch silhouette score, confirming that the representation captured biological signal rather than technical artifacts.
## Computational Scalability
Practical applicability requires that the framework scale efficiently to large datasets. A comprehensive scalability analysis evaluated runtime and GPU memory usage across 30 configurations varying in marker count and sample size. Average epoch time ranged from 0.63 to 22.86 seconds, with training time increasing approximately linearly with dataset size. Per-sample processing time decreased at larger batch sizes, indicating sub-linear scaling behavior and favorable computational efficiency.
GPU memory utilization remained modest across all tested configurations, with maximum usage of only 235 MB for the largest configuration evaluated in the initial benchmark. Memory consumption was driven primarily by marker dimensionality rather than sample size. For whole-slide-scale settings involving up to one million cells per sample, peak GPU memory was bounded at approximately 1.06 GB, with peak resident CPU memory around 1.45 GB. These results confirm that the framework is computationally practical for large-scale spatial datasets, including those approaching whole-slide tissue image resolution.
## Ablation and Sensitivity Analyses
Several ablation studies were conducted to validate the contribution of individual framework components. A crop-sensitivity analysis tested whether partial observation of tissue regions affected predictions. When large tissue regions were cropped to 50% of their original size, predictions remained highly concordant with full-region predictions (mean Spearman correlation of 0.943), and cell-type composition of important nodes remained stable (Pearson correlation 0.83–0.97). These results indicate moderate robustness to partial tissue observation, though ROI restriction is acknowledged as a limitation for both prediction and interpretation.
A second ablation study progressively removed important nodes and their incident edges from the input graph, comparing the effect against removal of matched non-important nodes. Removal of important nodes consistently produced larger decreases in model performance across all ablation levels, with mean output decreases of 0.2175 versus 0.1289 at 80% removal. This monotonic pattern confirms that the explainer-identified regions are functionally relevant to model predictions.
Finally, a synthetic validation study used a toy dataset with a known ground-truth spatial signal—intratumoral CD8 enrichment in positive samples and stromal CD8 enrichment in negative samples. The explainer selectively highlighted intra-tumoral CD8 nodes over stromal CD8 nodes, with mean importance of 0.0467 versus 0.0162 (p-value < 10⁻¹³), validating that the explanation component can recover known spatial motifs without relying on cell-type labels during training.## Frequently Asked Questions**What types of tissue data can be used with this framework?** The framework is designed to work with spatially resolved proteomic data where protein abundance measurements are available at single-cell resolution alongside spatial coordinates. It has been validated on imaging mass cytometry and CODEX multiplexed imaging data, but the underlying approach—constructing spatial graphs and training a graph neural network—is compatible with any data modality that can be represented as cell-level features with spatial adjacency information.**Why are cell-type annotations not used as model inputs?** Cell-type and compartment annotations are deliberately excluded from model features to ensure the framework learns patterns directly from protein abundance measurements and spatial relationships. This design choice prevents the model from relying on predefined biological categories and allows it to discover novel spatial patterns that may not align with existing cell-type taxonomies. These annotations are retained for post hoc interpretation and biological validation of the results.**How does the framework handle survival data with censoring?** For survival prediction tasks, the framework uses a censoring-aware time-to-event formulation. This means the model can properly account for patients whose follow-up time is limited (censored observations), incorporating both the time and event status into the training objective. This approach is more appropriate for clinical outcome prediction than simple binary classification when the data includes censored observations.**What does it mean when importance values are described as "unsigned"?** The importance scores produced by the explainer quantify the magnitude of relevance—identifying which cells, edges, and spatial regions are most influential for the model's prediction. However, they do not indicate the direction of that effect, meaning they do not by themselves reveal whether a given molecular signal is associated with better or worse outcomes. Directional interpretation requires downstream differential analysis comparing important regions between outcome groups.**Can the framework be applied to non-cancer tissues?** While the published validation focused on cancer tissues, the framework itself is agnostic to tissue type. Any spatially resolved tissue dataset with cell-level protein measurements, spatial coordinates, and clinically relevant outcome labels can be used. The graph-based architecture and explainable AI component are designed to be general-purpose tools for spatial data analysis.**How robust is the framework to incomplete tissue sections or partial field-of-view imaging?** Ablation studies showed that predictions remain highly concordant when tissue regions are cropped to 50% of their original size, with risk-tier agreement averaging 0.823. However, this does indicate that ROI restriction is a recognized limitation—both for prediction accuracy and for interpretation. The framework performs best when complete tissue regions are available for analysis.## ConclusionThe framework represents a significant advance in the analysis of spatially resolved tissue data, combining the representational power of graph neural networks with the interpretability of explainable AI to uncover clinically relevant spatial patterns. By transforming tissue samples into spatial graphs and identifying compact, connected subgraphs that drive predictions, the framework bridges the gap between complex high-dimensional spatial data and actionable clinical insights. Validation across multiple independent cohorts and imaging modalities demonstrates its robustness, generalizability, and superior predictive performance compared to non-spatial alternatives. The framework's ability to generate spatially localized, biologically interpretable explanations—rather than relying on black-box predictions—positions it as a valuable tool for understanding tumor heterogeneity, guiding patient stratification, and identifying potential therapeutic targets within the tumor microenvironment. As spatial omics technologies continue to mature and generate larger datasets, approaches like this will become increasingly essential for translating raw molecular measurements into clinical knowledge.Thank you for reading
