



# Is Bitcoin’s ‘Bart Simpson’ Pattern a Real Threat? What Traders Are Watching Right Now
## The Setup: A Spike, a Stalemate, and a Meme
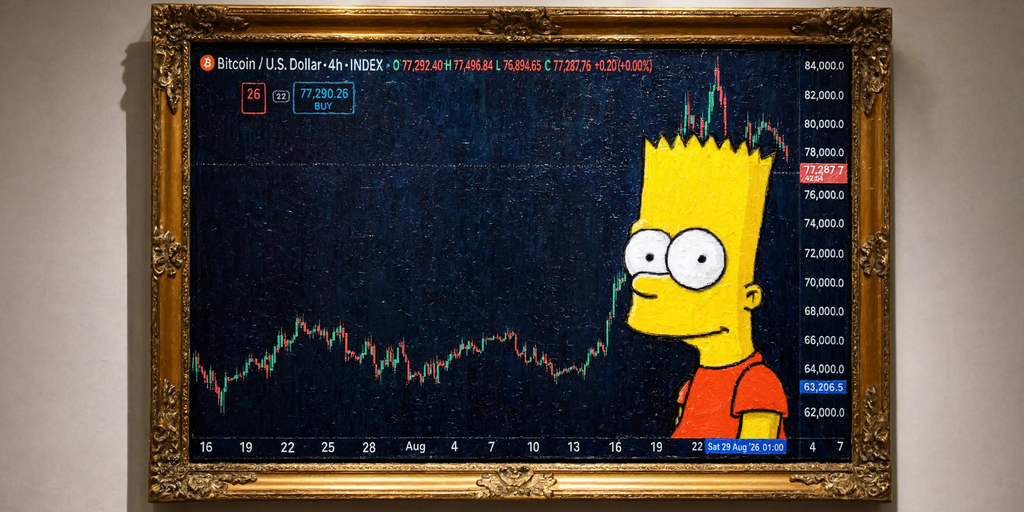
Bitcoin rallied roughly 25% in late August, surging from around $64,400 to a peak near $80,700 in just six trading sessions. Since then, the world’s largest cryptocurrency has been stuck in a holding pattern, drifting sideways around the $77,500 mark while traders debate what comes next.
The phrase filling crypto chat rooms and Twitter threads is “Bart Simpson” — a nickname for a specific chart formation that resembles the character’s iconic spiky silhouette. The pattern describes a rapid directional move followed by a period of tight, sideways consolidation, and then a sharp reversal back toward the starting point of the initial surge.
It’s important to understand that the Bart Simpson is not a formal technical indicator. It’s a visual metaphor that originated in crypto trading communities around 2015 and pops up whenever Bitcoin executes a fast, narrow-range rally similar to August’s move.
## What the Numbers Actually Say
A closer look at Bitcoin’s four-hour chart reveals a market sending mixed signals. The Relative Strength Index, which measures whether an asset is overbought or oversold on a 0-to-100 scale, currently sits at approximately 44.8 — leaning toward the bearish side but far from the sub-30 zone that usually signals a genuine breakdown.
The Average Directional Index, which measures trend strength regardless of direction, is reading around 22. That falls below the 25 threshold most traders use to confirm that a real trend is in place. The Squeeze Momentum indicator, which flags periods of compressed volatility preceding a breakout, is currently signaling bearish pressure with weakening momentum.
However, the 50-period exponential moving average remains positioned above the 200-period moving average — a textbook marker of a bullish trend structure on the broader timeframe. This structural setup makes a full flash-crash scenario less likely unless something dramatic breaks it apart.
## What Would a Real Flash Crash Look Like?
For the Bart Simpson pattern to fully confirm itself, the reversal would need to happen at a pace comparable to the original rally. Applied to Bitcoin’s August move, that would mean losing the entire 25% gain within hours rather than weeks, snapping back toward the $64,000 area — roughly a 17% single-session plunge.
That kind of move requires a specific catalyst. A break below the $75,800 level is the key line in the sand. Staying above that threshold would tend to invalidate the bearish setup. A genuine flash crash would also demand a violent trigger, such as cascading leveraged liquidations. Bitcoin has delivered events of that scale before, including a massive $19 billion liquidation event tied to tariff fears in late 2025. The mechanism exists; it simply hasn’t activated in the current setup.
## Why September Matters
The Bart Simpson chatter is landing during what has historically been Bitcoin’s weakest month. Over the last 13 Septembers, the cryptocurrency has closed in the red eight times, with an average loss of roughly 3%. No other month on the calendar has such a poor average and median performance. Market participants have taken to calling it “Red September.”
This year, the seasonal weakness collides with a critical Federal Reserve decision scheduled for September 15-16. Current market pricing suggests a roughly 64% probability of a rate hike at that meeting. Higher interest rates typically weigh on risk assets like crypto because they make traditional safe havens like gold and bonds more attractive.
Supporting the bearish case, spot Bitcoin ETFs saw approximately $236 million in outflows in a single session, and geopolitical tensions in the Middle East have pushed oil prices above $90 per barrel, reinforcing the argument for a hawkish Fed move.
These factors alone don’t guarantee a crash, but they are worth weighing before making any trading decisions. A rate-driven risk-off move and a Bart Simpson flash crash are two separate mechanisms that, for now, appear to be pointing in the same direction.
## The Alternative: A Slow Descent Rather Than a Cliff
There’s another bearish scenario that doesn’t resemble a Bart Simpson at all. When analysts draw a descending trendline from the August high of roughly $80,600 and factor in the current support levels, the result is a gradual downward channel that could carry Bitcoin toward $62,000 over a period of about eight weeks, well into late October.
That represents a similar percentage decline as the flash-crash version but stretched across a seasonally weak September and a historically volatile October instead of compressed into a single violent session.
This slow-bleed pattern is not new for Bitcoin. Earlier this year, analysts noted the cryptocurrency was tracing a compressive wedge — a series of lower highs against a descending resistance line — that preceded grinding structural breakdowns in October 2025 and January 2026. Both were slow, methodical declines, not one-candle flash crashes. A gradual slide with lower highs and lower lows remains bearish in nature, but it plays out very differently from a Bart Simpson pattern.
The distinction is crucial for anyone trying to navigate this environment. A flash crash demands a liquidation event and a fast break below $75,800. A slow correction needs September’s seasonal headwinds, a potential Fed hike, and patience.
—
## Frequently Asked Questions
**What is the Bart Simpson pattern?**
It’s a chart-formation nickname used in crypto trading circles. It describes a sharp price spike, followed by a period of tight sideways movement, and then a rapid reversal back toward where the move began — mimicking the shape of the cartoon character’s spiky hair.
**Is the Bart Simpson a technical indicator?**
No. It is purely a visual pattern and a trading meme that has circulated since around 2015. It is not based on any formal mathematical or statistical formula.
**What does the current RSI reading mean for Bitcoin?**
Bitcoin’s RSI is around 44.8, which leans bearish but is nowhere near oversold territory. A true breakdown often accompanies RSI readings below 30.
**What is the key price level to watch?**
$75,800 is the critical threshold. A break below it would confirm the bearish Bart setup, while holding above it would tend to invalidate the pattern.
**What are the two main scenarios for Bitcoin’s next move?**
The first is a flash crash — a rapid 17% drop back toward $64,000, requiring a forced-liquidation catalyst. The second is a gradual correction sliding toward $62,000 over roughly two months, driven by seasonal weakness and macroeconomic factors.
**Why is September significant for Bitcoin?**
Bitcoin has closed eight of the last 13 Septembers in the red, making it the weakest month on average. This year it coincides with a likely Federal Reserve rate decision.
**Can a flash crash and a slow correction happen at the same time?**
No, they are distinct scenarios with different timelines and triggers. A flash crash unfolds in hours; a gradual correction stretches over weeks.
—
## Conclusion
Bitcoin’s current price action has sparked lively debate among traders, with the Bart Simpson pattern at the center of the conversation. The evidence on the ground is contradictory: some indicators point toward an impending bearish break, while the broader trend structure suggests strength remains intact. The September seasonal headwinds, combined with the upcoming Federal Reserve decision, add another layer of uncertainty that could tip the balance in either direction.
Traders watching for a flash crash should keep an eye on the $75,800 level as the line that separates possibility from confirmation. Those expecting a slower, grinding correction have their own framework centered on the descending trendline and the broader seasonal calendar. Either way, volatility appears to be on the horizon, and positioning without a clear plan carries real risk.
Whether this week ends with a Bart Simpson reversal or something entirely different, the situation underscores why technical patterns should always be paired with fundamental context — rate decisions, liquidity events, and macro shifts all play a role in shaping where the price actually goes.
Thank you for reading
