


Key takeaways:
- Bitcoin could dip below $65,000, though such a drop would likely trigger strong buying interest from bullish investors.
- HYPE, ZEC, and XLM are showing strength on technical charts, while other leading altcoins face the risk of continuing their downward slide.
Bitcoin (BTC) is trying to recover from the $65,426 level, but buyers are having trouble keeping the price elevated. The escalation of military strikes involving the US and Iran has dampened market mood, yet Andri Fauzan Adziima, research lead at Bitrue Research Institute, explained to Cointelegraph that the sell-off was driven more by “forced liquidations of leveraged positions, significant outflows from ETFs, and technical breakdowns rather than solely by Iran-related news—though the geopolitical tension certainly intensified the fear.”
Market attention is now firmly on BTC’s yearly low near $60,000. Well-known trader Peter Brandt shared on X that BTC has developed an expanding triangle formation, a widely recognized and dependable chart pattern. He forecasts a potential slide to around $56,000, but noted that a push above $75,000 would negate this bearish outlook.
Daily crypto market overview. Source: TradingView
The near-term momentum has shifted to the downside, but bulls are expected to put up a strong fight rather than surrender. Purchasing activity is anticipated in the $65,000–$60,000 range, though any recovery rallies are likely to face selling pressure. Volatility is expected to ramp up in the coming days as buyers and sellers compete for control. For BTC to confirm a short-term bottom, buyers need to drive the price above $77,000.
Which key support levels should you monitor for BTC and the top altcoins? Let’s dive into the charts of the 10 largest cryptocurrencies to find out.
Bitcoin price outlook
BTC plunged after dropping below its support line on Tuesday, signaling aggressive unwinding of long positions.
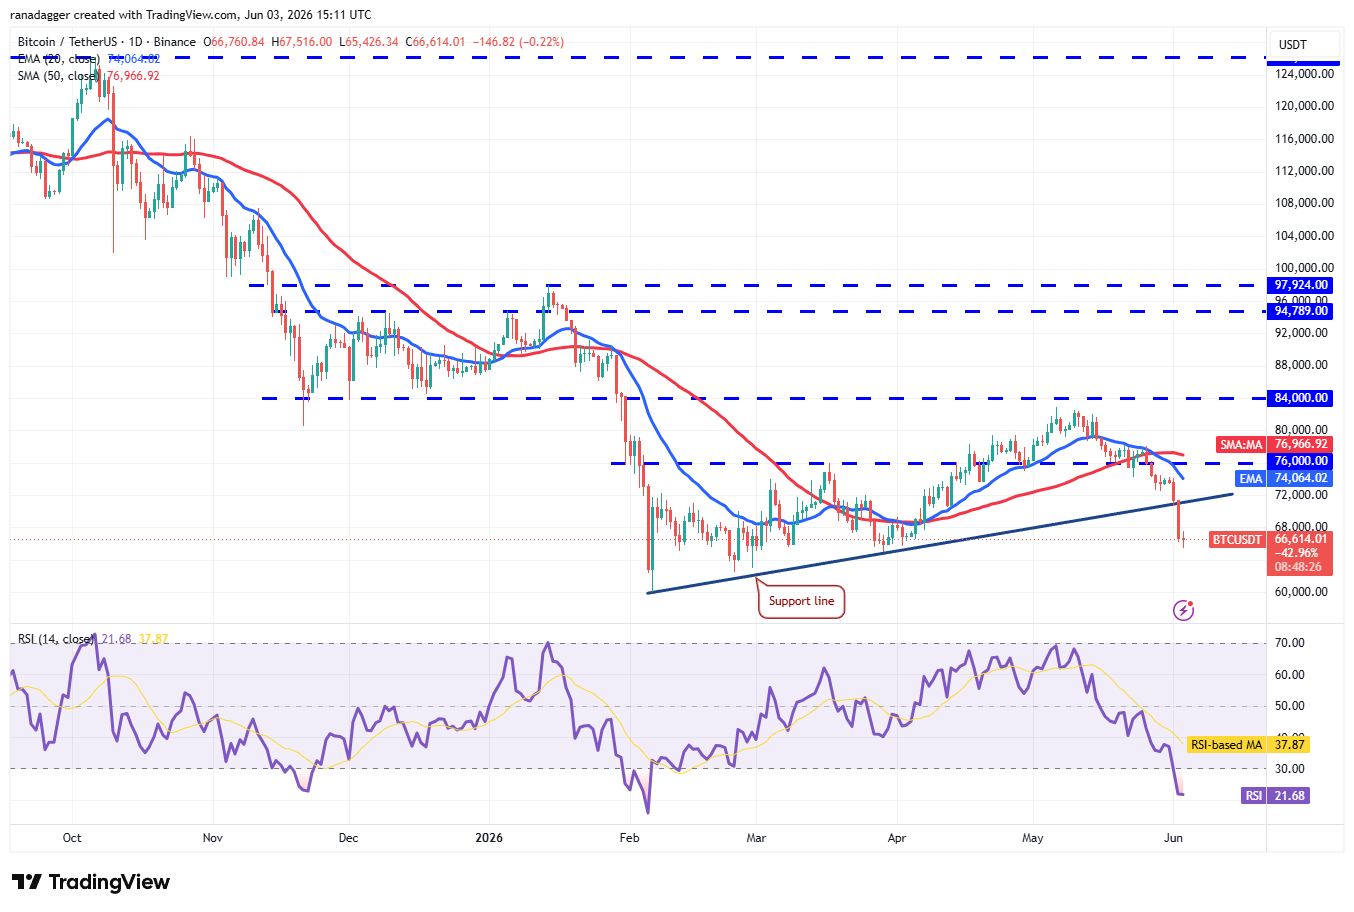
BTC/USDT daily chart. Source: Cointelegraph/TradingView
There is a support level at $65,000, but it may not hold. That opens the door for a decline toward the $62,500–$60,000 support zone. Buyers are expected to defend this zone aggressively, since a close below it would indicate the downtrend is resuming. The BTC/USDT pair could then slide as low as $50,000.
Bears will try to keep their edge by selling into any relief rallies toward the 20-day exponential moving average ($74,064). Buyers need to secure a close above the 50-day simple moving average ($76,966) to signal a genuine recovery.
Ether price outlook
Ether (ETH) broke below its $1,916–$2,465 trading range on Tuesday, confirming that sellers are in the driver’s seat.
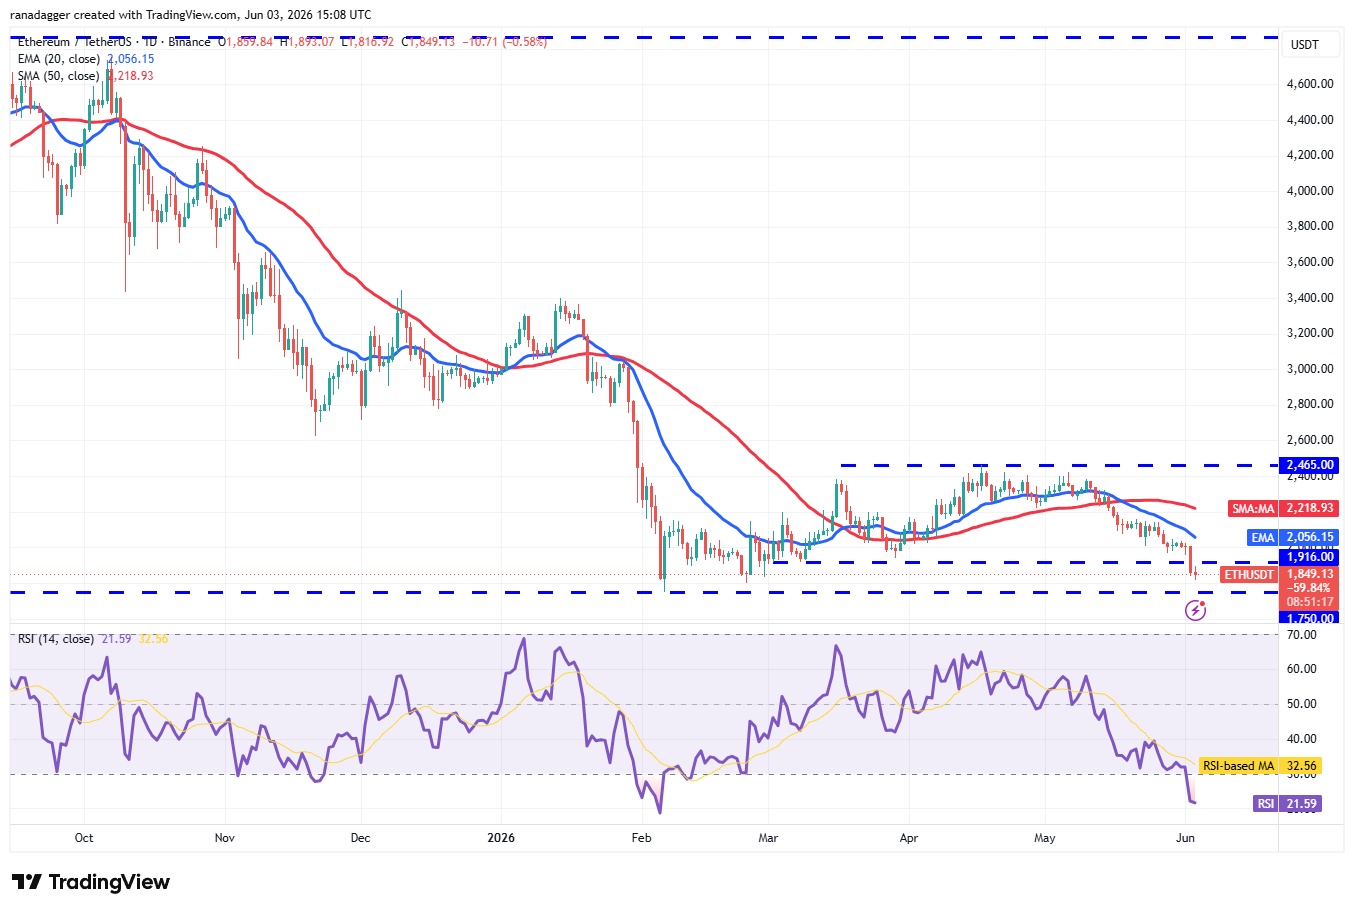
ETH/USDT daily chart. Source: Cointelegraph/TradingView
The ETH/USDT pair could decline to the strong support at $1,750. The oversold reading on the relative strength index (RSI) hints at a possible bounce from $1,750, but any rallies are likely to attract sellers. A weak rebound raises the odds of a breakdown below $1,750. Should that occur, the ETH price could tumble to $1,550.
Buyers face a tough challenge ahead. They need to quickly push and hold the price above the 20-day EMA ($2,056) to suggest that selling pressure is fading. The pair could then advance toward the 50-day SMA ($2,218).
BNB price outlook
BNB (BNB) dropped below the $687 breakout level on Monday and continued falling to the 50-day SMA ($645) on Tuesday.
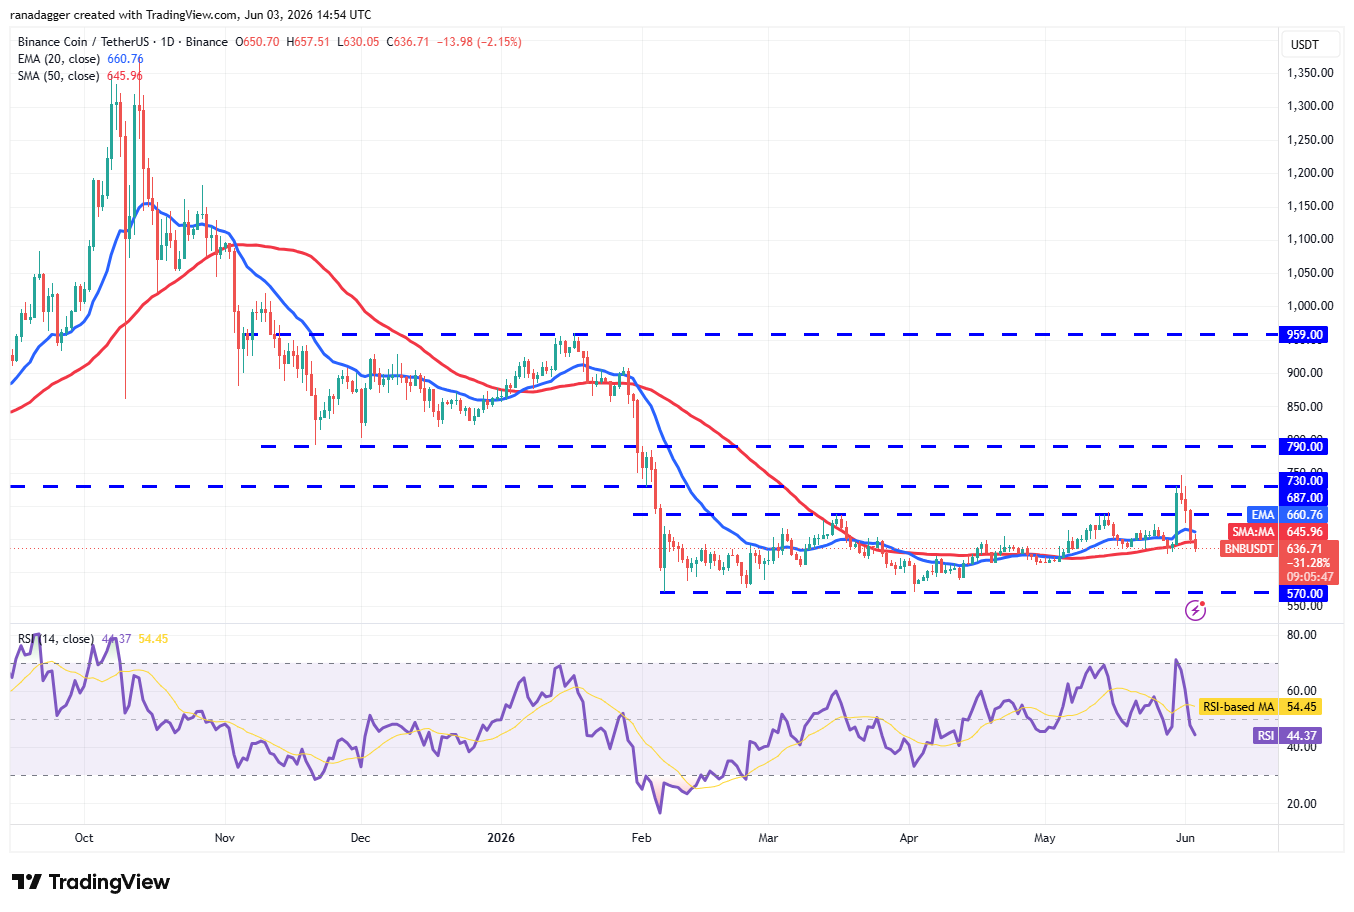
BNB/USDT daily chart. Source: Cointelegraph/TradingView
The retreat back below $687 may have caught aggressive bulls off guard. The $628 level could serve as temporary support, but it is likely to give way. If that happens, the BNB/USDT pair could plunge to the strong support at $570.
This bearish scenario will be overturned in the near term if the BNB price rebounds sharply from its current level and breaks above $745. That would signal robust demand at lower prices. The pair could then advance toward $790 and subsequently to $900.
XRP price outlook
XRP (XRP) broke below the key support at $1.27 on Tuesday, confirming that bears are in command.
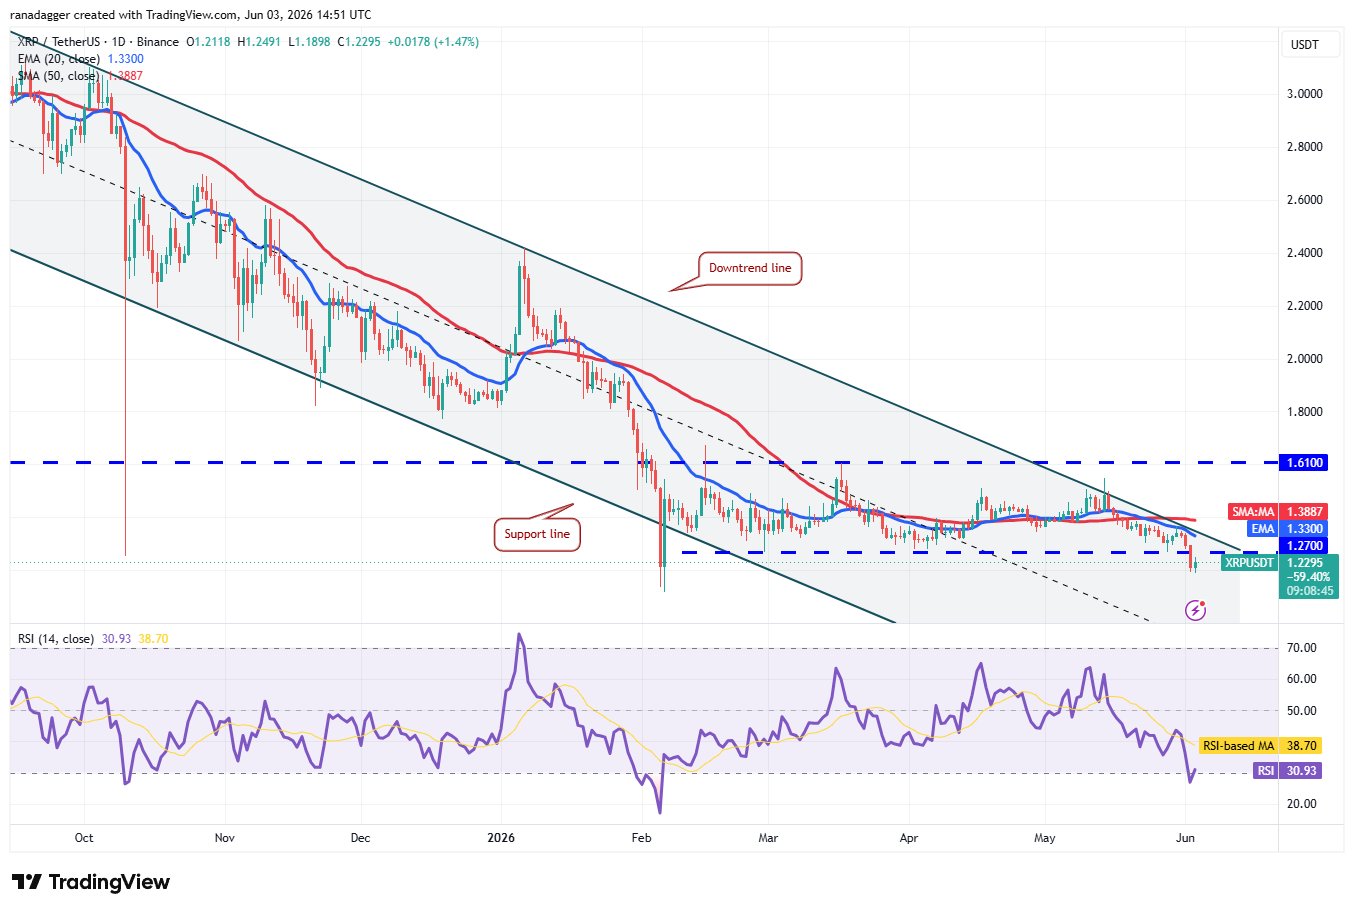
XRP/USDT daily chart. Source: Cointelegraph/TradingView
The next downside support is the February 6 intraday low of $1.11. Buyers are expected to defend the $1.11 level vigorously, since a close below it would mark the beginning of the next leg down toward $1.
On the upside, the downtrend line is the first obstacle bulls need to clear. If they manage to break through, the XRP/USDT pair could rally to $1.61. Sellers are likely to mount a strong defense at the $1.61 level, but if bulls overcome it, a fresh upward move could get underway.
Solana price outlook
Solana (SOL) closed below the $76 support on Tuesday, showing that bears have gained the upper hand over bulls.
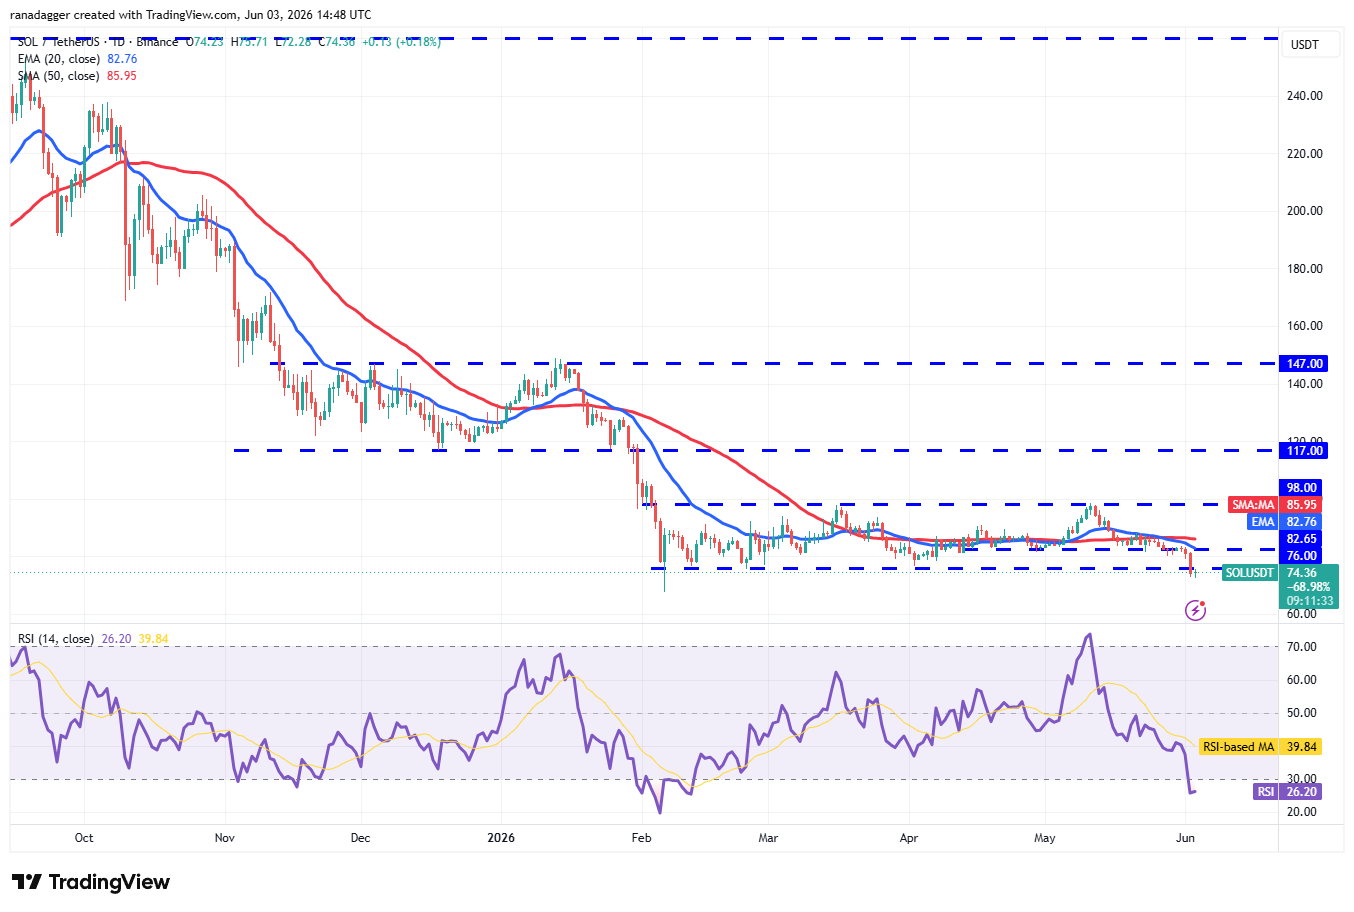
SOL/USDT daily chart. Source: Cointelegraph/TradingView
Bulls will try to push the SOL price back above $76, but are likely to encounter stiff resistance from sellers. If the price turns down from $76, the next target is likely the February 6 low of $67. Buyers will aim to hold the $67 level, as a close below it could drag the SOL/USDT pair down to $60.
Buyers need to push and sustain the price above the moving averages to suggest that the break below $76 may have been a bear trap.
Hyperliquid price outlook
Hyperliquid (HYPE) has remained resilient amid the widespread turmoil, indicating that bulls are confident the uptrend will persist.
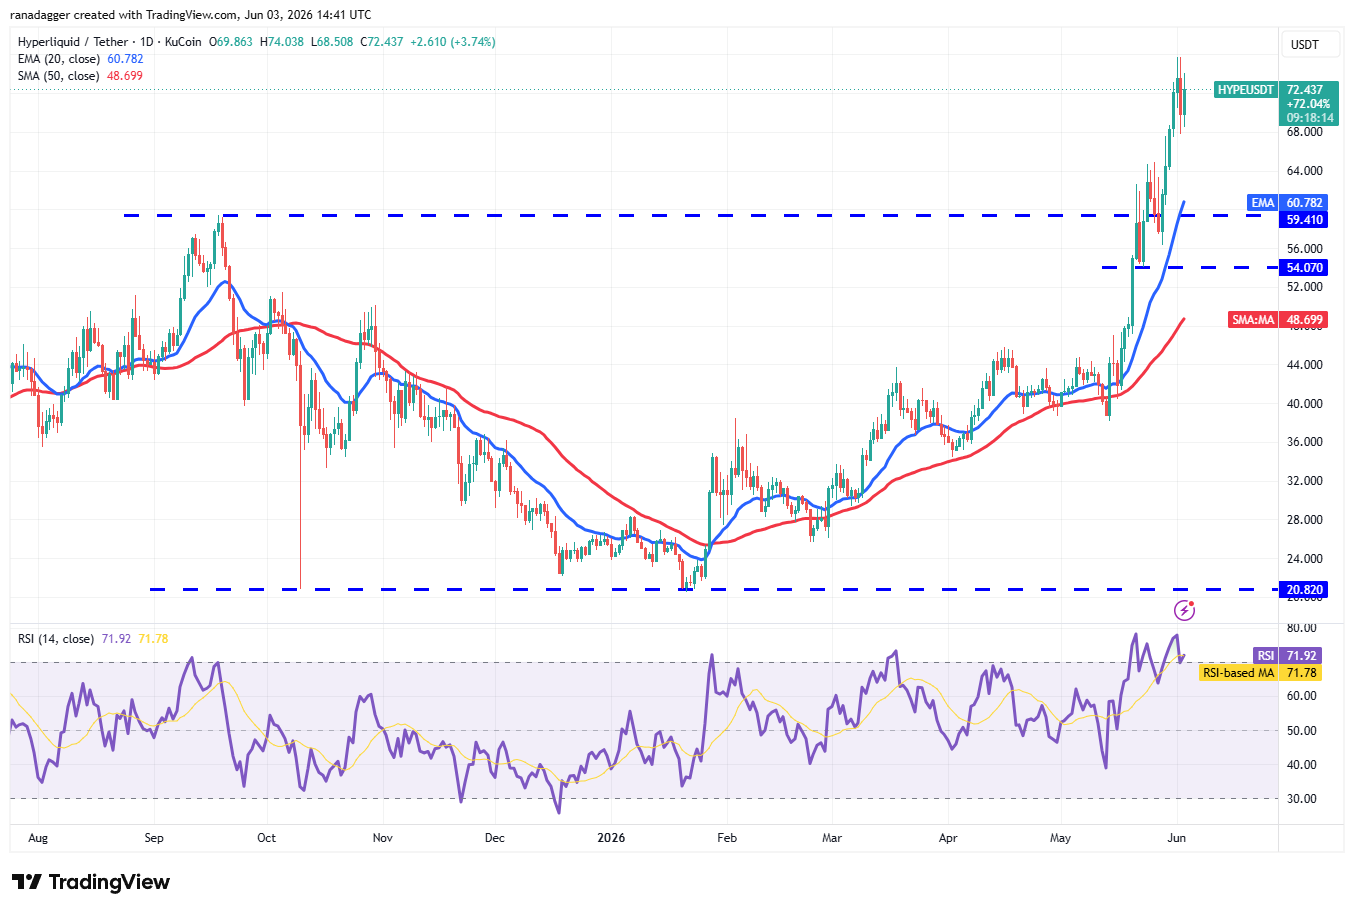
HYPE/USDT daily chart. Source: Cointelegraph/TradingView
Profit-taking
was seen near $75, but the minor dip indicates that bullish investors are treating price drops as chances to buy. Should buyers push HYPE above $75, the upward move could extend toward the $85–$89 range.
The first level of downside support sits at $64, followed by the breakout point at $59.41. A bounce from $59.41 would signal that bulls have converted that level into a support zone. From there, buyers will likely try to restart the upward trend.
Dogecoin price prediction
Dogecoin (DOGE) has pulled back to the $0.09–$0.12 support zone, where buyers are anticipated to enter the market.
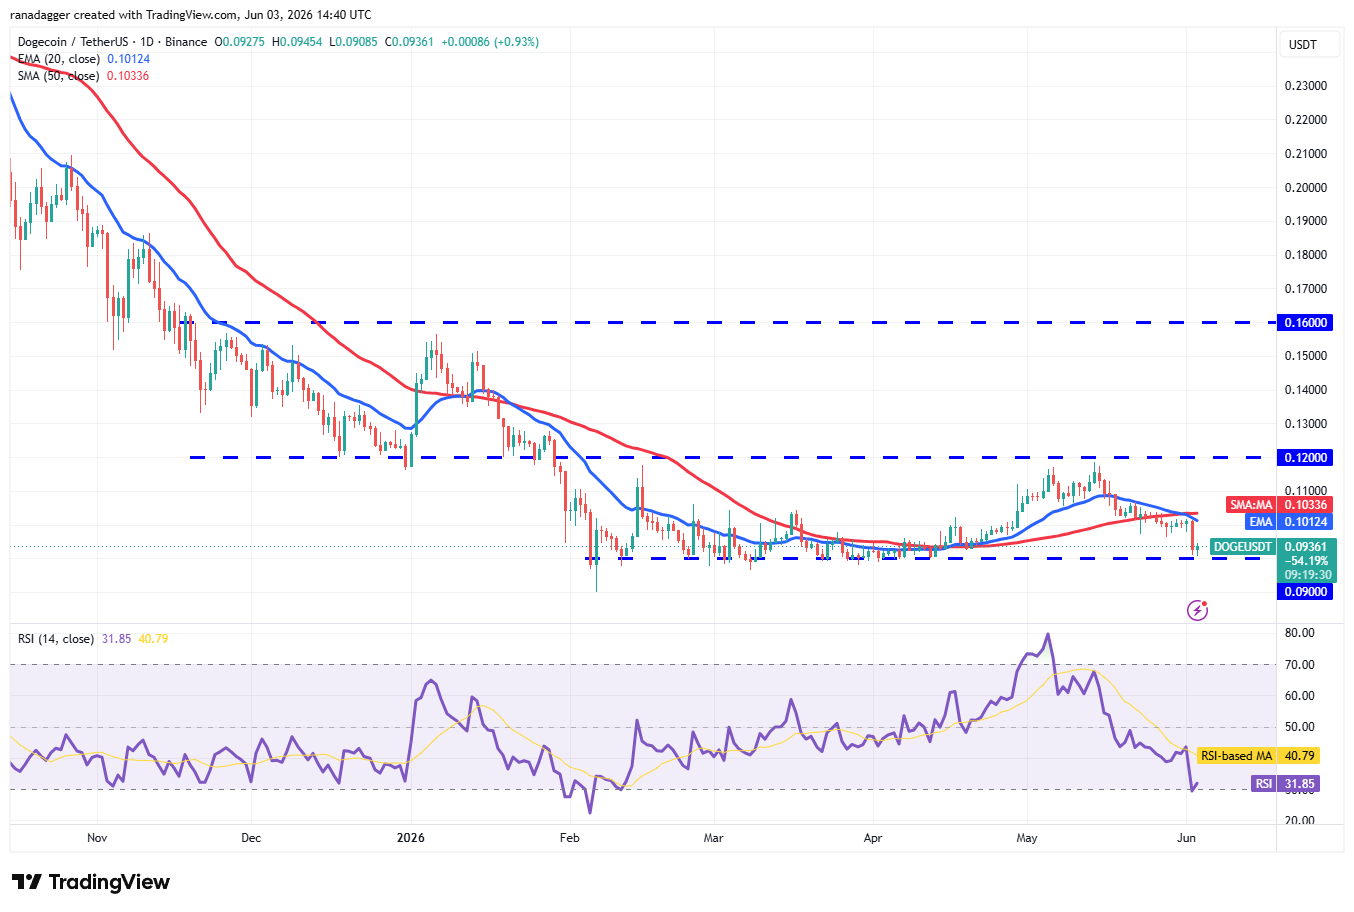
DOGE/USDT daily chart. Source: Cointelegraph/TradingView
If DOGE rebounds from its current price, sellers will likely try to block the recovery at the 20-day EMA ($0.10). A sharp rejection from that moving average raises the risk of a drop below $0.09, potentially sending the DOGE/USDT pair down to $0.08.
This bearish outlook would be negated in the near term if the price climbs above the moving averages, implying the pair could remain range-bound for several more days.
Related: Bitcoin copying 2022 ‘almost perfectly’ as trader sees key support failing
Zcash price prediction
Zcash (ZEC) bounced back and closed above the 20-day EMA ($568) on Tuesday, signaling demand at lower prices.
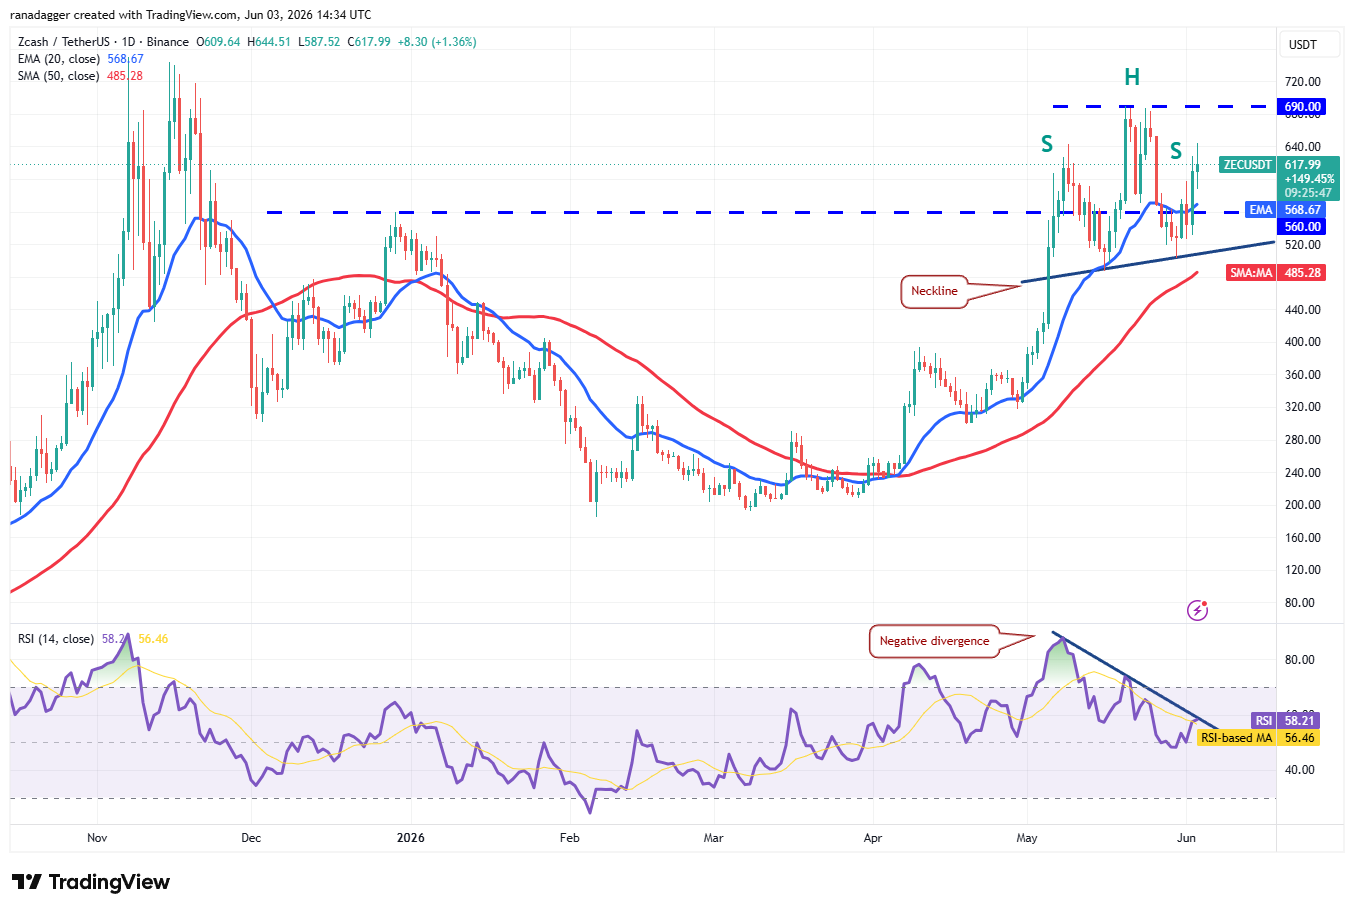
ZEC/USDT daily chart. Source: Cointelegraph/TradingView
Bulls need to push and hold ZEC above $690 to confirm the uptrend is resuming. Achieving that could propel the ZEC/USDT pair toward $750, where sellers are expected to put up strong resistance. A break above that barrier could send the pair soaring to $856.
However, sellers likely have a different strategy. They will try to drag the price below the neckline of a forming head-and-shoulders pattern. A close below that neckline would indicate the pair may have peaked in the short term.
Cardano price prediction
Cardano (ADA) continued its decline, falling below the $0.22 support level on Tuesday, confirming the downtrend has resumed.
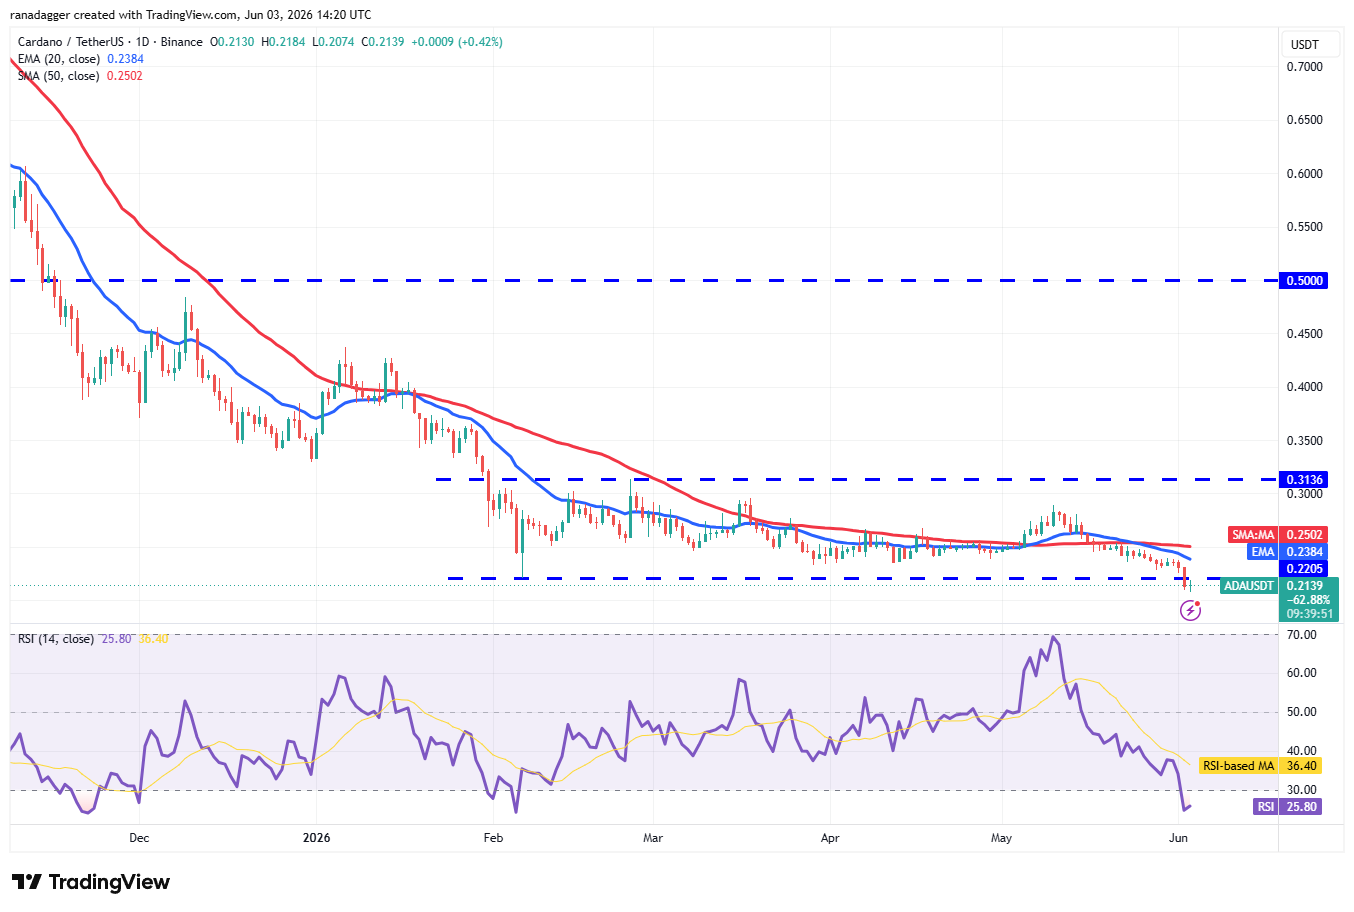
ADA/USDT daily chart. Source: Cointelegraph/TradingView
The RSI has entered oversold territory, making a period of consolidation or a short-term relief bounce more likely. Any recovery effort is expected to encounter selling pressure at $0.22 and then at the 20-day EMA ($0.24). If ADA fails to break through that overhead resistance, bears will aim to push the ADA/USDT pair down to $0.20.
Bullish control would be reestablished on a close above the 50-day SMA ($0.25), suggesting the market has rejected the breakdown below $0.22.
Stellar price prediction
Stellar (XLM) has been in its own bull run, climbing from $0.14 on May 23 to $0.30 on May 30.
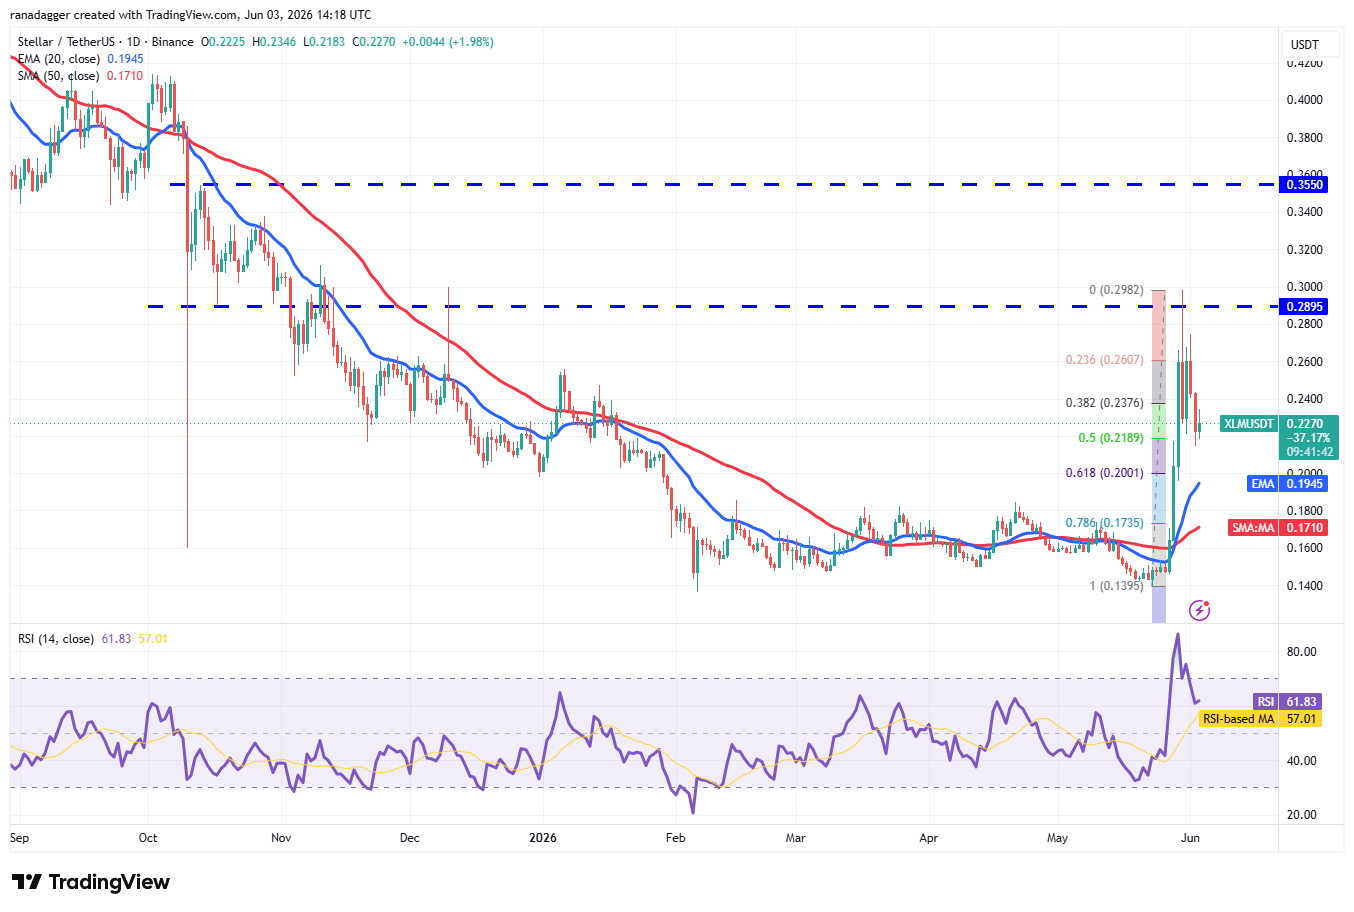
XLM/USDT daily chart. Source: Cointelegraph/TradingView
The rapid rally triggered profit-taking among short-term traders, pulling XLM back to the 50% Fibonacci retracement level at $0.22. If the price rebounds from here, bulls will try to push the XLM/USDT pair above $0.27 and then $0.30. A successful break could send the pair surging toward $0.35.
On the other hand, if the price drops and breaks below the 61.8% retracement level at $0.20, it would suggest the pair may have reached a near-term top.