




If you’re managing GPU-powered tasks on Kubernetes—whether it’s vLLM, Triton, training pipelines, or the latest agentic inference systems—you’ve likely run into a common issue: the default autoscaling system mainly looks at CPU and memory, completely ignoring the GPU doing the heavy lifting. This leads to inefficient use of costly accelerators, slower inference times, and unnecessary power consumption, which is a major concern for organizations trying to responsibly scale LLMs and Agentic Operations.
My goal was to make KEDA respond to the metrics that actually matter for GPU workloads: utilization, memory usage, temperature, and power draw. Beyond just a cost issue, this is also a GreenOps concern because every wasted GPU cycle directly adds to energy waste and higher Scope 3 emissions.
As it turns out, this was far trickier than I anticipated.
The Challenge
KEDA is compiled with CGO_ENABLED=0. The standard tool for reading GPU metrics, NVIDIA Management Library (NVML), requires CGO. So, building a native GPU scaler for KEDA’s core, similar to the Prometheus or Kafka scalers, wasn’t possible.
There’s another hurdle: KEDA’s operator runs as a single deployment. NVML queries are limited to the local node—you can’t check the GPU status on node-A from a pod on node-B.
Since a built-in KEDA scaler wasn’t an option, I needed a solution that could run on every GPU node and present metrics over the network.
The Solution
To work around this, we can create a custom DaemonSet (see my reference implementation here: keda-gpu-scaler) that’s deployed on every GPU node. In this setup, each pod:
1. Uses [go-nvml] via NVML to fetch local GPU metrics.
2. Exposes these metrics via gRPC using KEDA’s ExternalScaler protocol.
3. The KEDA operator then connects to these scalers to control the HPA (Horizontal Pod Autoscaler).
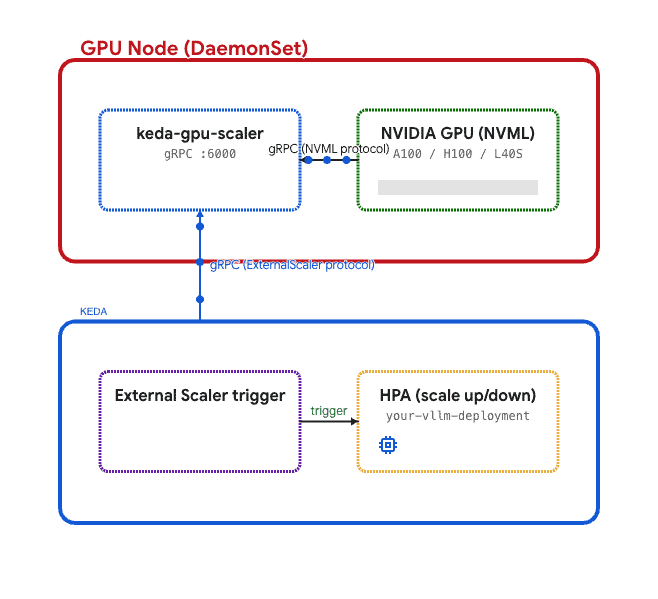
This follows the same model Kubernetes uses for device plugins and the metrics server—a per-node agent responsible for collecting hardware-specific data.
Available Scaling Metrics
The scaler reports the following metrics for each GPU:
- gpu_utilization – Percentage of time the GPU’s compute units are active
- memory_utilization – Usage level of the memory controller
- memory_used_percent – Percentage of VRAM currently used
- temperature – GPU core temperature in degrees Celsius
- power_draw – Real-time power consumption in watts
For systems with multiple GPUs, you can aggregate these numbers using max, min, avg, or sum. Alternatively, you can target a specific GPU by its index.
Ready-to-Use Profiles
Since most GPU workloads fall into a few standard categories, I’ve included pre-configured profiles with smart defaults:
triggers:
  - type: external
    metadata:
      scalerAddress: "keda-gpu-scaler.gpu-scaler.svc.cluster.local:6000"
profile: "vllm-inference"| Profile | Metric | Target | Activation | Best For |
| vllm-inference | memory_used_percent | 80% | 5% | LLM serving, supports scaling down to zero |
| triton-inference | gpu_utilization | 75% | 10% | Triton model serving |
| training | gpu_utilization | 90% | 0% | Training jobs (no scale-to-zero) |
| batch | memory_used_percent | 70% | 1% | Batch inference, quick scale-down |
Any profile setting can be overridden. You can also skip profiles altogether and specify metricType, targetValue, and activationThreshold manually.
Getting Started
Installation via Helm
helm install gpu-scaler deploy/helm/keda-gpu-scaler
  --namespace gpu-scaler --create-namespace
This command deploys a DaemonSet that automatically targets nodes with nvidia.com/gpu.present=true and tolerates the nvidia.com/gpu taint. It uses the NVIDIA container runtime by default—if your cluster doesn’t support this, enable nvmlHostMounts.enabled=true to mount the required device files directly.
Setting Up a ScaledObject
apiVersion: keda.sh/v1alpha1
kind: ScaledObject
metadata:
  name: vllm-gpu-scaler
spec:
  scaleTargetRef:
    name: vllm-deployment
  minReplicaCount: 0
  maxReplicaCount: 8
  triggers:
    - type: external
      metadata:
        scalerAddress: "keda-gpu-scaler.gpu-scaler.svc.cluster.local:6000"
        profile: "vllm-inference"
That’s all it takes. KEDA will now scale your vLLM deployment based on actual GPU memory usage, including the ability to scale down to zero when the workload is idle.
Testing Without Physical GPUs
A mock collector mode is available for testing and CI. The end-to-end test suite launches a gRPC server with simulated GPU data and validates the complete flow: IsActive → GetMetricSpec → GetMetrics. It includes 11 tests covering profiles, error handling, streaming, and aggregation methods—all executable without any real GPU hardware.
go test -v -tags=e2e -race ./tests/e2e/Looking Ahead
Creating custom external scalers is a flexible way to expand the CNCF ecosystem. It demonstrates how a mature project like KEDA remains adaptable, enabling engineers to develop specialized DaemonSets that support modern AI infrastructure without cramming every workload into a single, inflexible model.
The code snippets and repository mentioned above provide an open-source reference for this architecture. If you’re running GPU workloads on Kubernetes and want autoscaling that truly understands GPU metrics, the KEDA ExternalScaler interface is an excellent starting point.
GitHub: [keda-gpu-scaler]
