


 After Recent Cybersecurity Sentiment Shift?")
- If you are wondering whether Okta’s share price reflects its true worth today, you are not alone. This article will help you frame that question clearly before you make any decisions.
- Okta shares last closed at US$92.23, with returns of 10.3% over the past week, 2.7% over the past month, 10.3% year to date and 9.3% over the last year, while the 3 year return stands at 32.2% and the 5 year return at a 63.5% decline.
- Recent headlines around Okta have focused on its role in identity and access management and ongoing interest in cybersecurity stocks, which helps explain why the share price can move quickly when sentiment shifts. Context around product adoption, customer relationships and the broader software sector has been central to how investors interpret these moves.
- On our checks, Okta scores 2 out of 6 on valuation, as shown by its valuation score. We will look at how different methods might justify that result and then finish with a way to think about value that goes beyond any single model.
Okta scores just 2/6 on our valuation checks. See what other red flags we found in the full valuation breakdown.
Approach 1: Okta Discounted Cash Flow (DCF) Analysis
A Discounted Cash Flow, or DCF, model takes estimates of a company’s future cash flows and discounts them back to today’s dollars, aiming to show what those future streams might be worth right now.
For Okta, the model used is a 2 Stage Free Cash Flow to Equity approach, based on cash flow projections. The latest twelve month free cash flow is reported at about $888.3 million. Analyst estimates and extrapolations point to free cash flow projections that reach $1,312.6 million in 2030, with interim annual figures provided out to 2035 in the model.
Simply Wall St’s DCF output suggests an estimated intrinsic value of US$121.84 per share. Compared with the recent share price of US$92.23, the model indicates the stock is about 24.3% undervalued on this set of assumptions and inputs.
This does not make the shares a clear bargain on its own. However, it does suggest that, based purely on these cash flow projections and discounting assumptions, the current market price sits below the DCF estimate.
Result: UNDERVALUED
Our Discounted Cash Flow (DCF) analysis suggests Okta is undervalued by 24.3%. Track this in your watchlist or portfolio, or discover 879 more undervalued stocks based on cash flows.
Head to the Valuation section of our Company Report for more details on how we arrive at this Fair Value for Okta.
Approach 2: Okta Price vs Earnings
For profitable companies, the P/E ratio is a common way to think about value, because it links what you pay for each share directly to the earnings that support that share. In simple terms, it shows how many dollars investors are currently willing to pay for one dollar of earnings.
What counts as a “normal” or “fair” P/E depends on how the market views a company’s growth potential and risk. Higher expected growth or lower perceived risk can justify a higher P/E, while slower growth or higher risk usually points to a lower P/E.
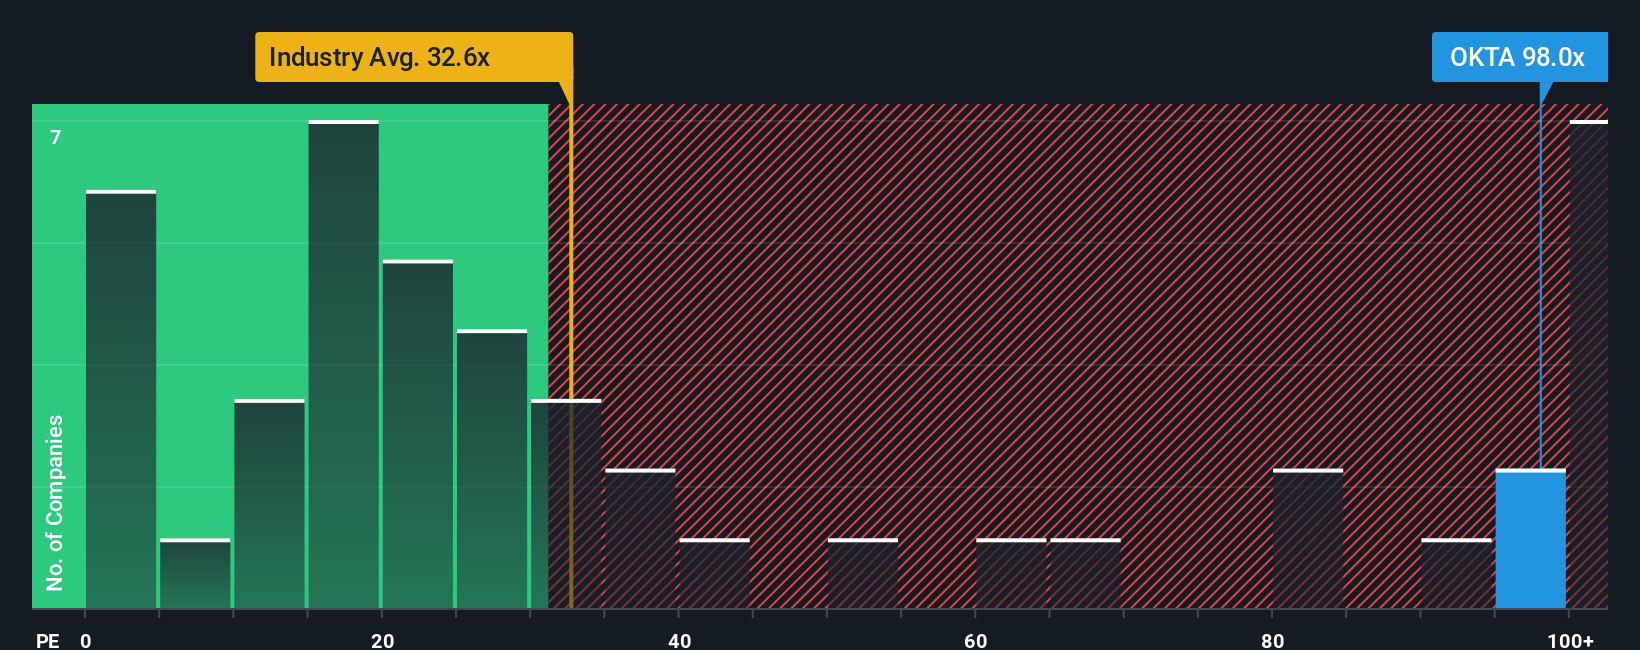
Okta currently trades on a P/E of 83.83x, compared with an IT industry average of about 31.14x and a peer group average of 30.53x. Simply Wall St’s Fair Ratio for Okta is 35.91x, which is its proprietary view of what a reasonable P/E might be, given factors such as earnings growth, industry, profit margins, market cap and risk profile. This Fair Ratio goes beyond a simple peer or industry comparison because it tries to align the multiple with Okta’s specific characteristics rather than broad group averages.
With the current P/E of 83.83x sitting well above the Fair Ratio of 35.91x, this approach points to the shares trading above that implied fair level.
Result: OVERVALUED
P/E ratios tell one story, but what if the real opportunity lies elsewhere? Discover 1443 companies where insiders are betting big on explosive growth.
Upgrade Your Decision Making: Choose your Okta Narrative
Earlier we mentioned that there is an even better way to understand valuation, so let us introduce Narratives. Narratives connect your view of Okta’s story to a set of revenue, earnings and margin forecasts, then to a fair value that you can compare with the current share price. All of this is available within Simply Wall St’s Community page, where Narratives update automatically when new news or earnings arrive and can differ widely. For example, one view suggests that Okta is about 39% under fair value with free cash flow of US$663m in 2025 and US$972m in 2028 and a fair value of US$147.87. Another view points to a fair value of about US$112.62 based on revenue growth of roughly 8.98%, a profit margin of around 11.53% and a future P/E of 64.8x.
Do you think there’s more to the story for Okta? Head over to our Community to see what others are saying!

This article by Simply Wall St is general in nature. We provide commentary based on historical data
and analyst forecasts only using an unbiased methodology and our articles are not intended to be financial advice. It does not constitute a recommendation to buy or sell any stock, and does not take account of your objectives, or your
financial situation. We aim to bring you long-term focused analysis driven by fundamental data.
Note that our analysis may not factor in the latest price-sensitive company announcements or qualitative material.
Simply Wall St has no position in any stocks mentioned.
New: AI Stock Screener & Alerts
Our new AI Stock Screener scans the market every day to uncover opportunities.
• Dividend Powerhouses (3%+ Yield)
• Undervalued Small Caps with Insider Buying
• High growth Tech and AI Companies
Or build your own from over 50 metrics.
Explore Now for Free
Have feedback on this article? Concerned about the content? Get in touch with us directly. Alternatively, email editorial-team@simplywallst.com